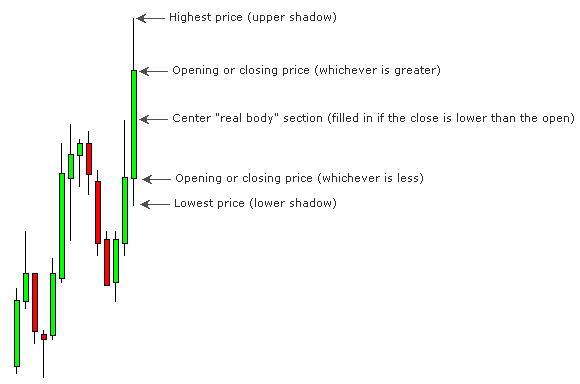

Candlestick charts represent an alternate way of displaying bar charts. In addition to displaying chart data using candlesticks, CQG offers you the ability to display candlestick formations.
These charts focus on the relationship between the opening price and the closing price and can help identify trends and daily volatility.
They can be used in various markets with various time intervals and various technical analysis methodologies.
This image shows both bearish and bullish reversal patterns in candlestick chart for different markets:

In the FX market, the Abandoned Baby pattern is similar to the Bearish Evening Doji Star pattern, while out of the FX market, the Abandoned Babies require gaps between the closing and opening prices of the second and third candles.
These formations are more fully described in Steve Nison's book, Japanese Candlestick Charting Techniques.
Candlesticks Parameters
|
Parameter |
Description |
|
Color |
Select colors for candlesticks, up candlesticks, and down candlesticks. |
|
MarkIt |
Opens the Specify Conditions for Marking Bar window. |
|
Hollow if C[-1]<C |
Tells the system to create a hollow candlestick if the previous close is less than the current close. |