
The magnet button, IntD button, and Hist button are always displayed on the chart toolbar. Other buttons can be added and removed as needed using Toolbar Manager. You can also add Chart Type, Pointer Tools, Studies, and Zoom toolbars using Toolbar Manager.
Magnet button
The Magnet button is used in two ways: as a snap mechanism with a pointer tool and to activate highlighting on the pop up value box.
Off:
On: 
The magnet strength can be adjusted. The strength denotes how close the point of the mouse has to be to the low (directly below it) for the line to snap and lock on the low. A setting of 50 is good for most people.
This button is always displayed.
1. Click the Magnet button to turn it on.
2. Select a pointer tool.
3. Move the cursor towards the value you wish to plot with the pointer tool.
4. When the value is highlighted in the pop up value box, click the chart. The pointer tool will snap to the value on the chart.
Note: Magnet snaps to particular bar values, such as the high. When you switch chart intervals with the Magnet turn on, the system reattaches the magnet to the same value on the nearest possible bar given the new time frame.
1. Click the Magnet button to turn it on.
2. Move the cursor to the desired high or low price on the chart. The pop up value box is displayed, and the high or low value is highlighted.
1. Right-click the Magnet button. The Chart Field Values window opens.
2. Either enter a value or use the arrows to select a value for Magnet Strength. The higher the value, the stronger the magnet.
3. Click OK.
SnapTrader button
Click this button to add SnapTrader or SnapTrader 2 to the chart. This button is displayed on the toolbar by default and is not visible if your system is not enabled for trading. Right-click the button to hide it.
The SnapTrader 2 button can be added to the application toolbar also.
Scroll buttons

These buttons allow you to scroll left and right and up and down.
•Click to scroll to the left on a chart. Right-click to scroll to the right on a chart.
•Click to scroll up on a chart by 5 units on the vertical axis. Right-click to scroll down on a chart by 5 units on the vertical axis.
Scale buttons

These buttons allow you to move up and down the price and times scales. The price scale arrows are vertical, and the time scale arrows are horizontal, just like the axes on the chart.
•Click to expand the chart time scale, decreasing the amount of data displayed. Right-click to compress the chart time scale horizontally, thereby increasing the amount of data displayed.
Keyboard equivalents: SHIFT + ← and SHIFT + →
•Click to expand the chart value/price scale vertically, thereby giving the more definition to the display. Right-click to compress the chart value/price scale vertically, thereby giving the display less definition.
Keyboard equivalents: SHIFT + ↑ and SHIFT + ↓
ReScl button
The Rescale button is a convenient tool to reset the chart scales to their default values.
Click the ReScl button to restore only the vertical, value/price scale to the default spacing. Keyboard shortcut = Home.
Right-click the ReScl button to restore both the Value/Price Scale and the Time Scale to the default spacing and to activate the AutoScale feature. Once the AutoScale feature is activated, the charts will automatically scale themselves until a manual scaling command is entered. Keyboard shortcut = Enter.
This setting applies to all studies on the active chart.
Studies button
Opens the Add Study window.
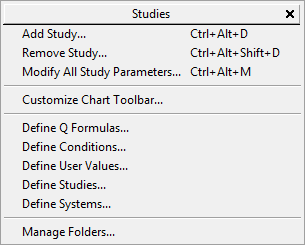
Right-click this button to open this menu:
The AnaLock button is used with overlaid charts and is available only if the Analog study is enabled.
When this button is turned on, the scales, both time and price, are locked for simultaneous scaling and scrolling of all charts.
When this button is turned off, you can modify each chart’s price and time scale separately. Modification is made only to the foreground chart. To change the background chart, bring it to the foreground (right-click a bar for those options).
Press CTRL to invert these actions. In this way, you can temporarily change the function of the button without having to turn it on and off.
Switches from a historical to an intraday chart. This button is always displayed.
1. Click or right-click the <IntD> button to change from a historical time interval to the last used intraday time interval.
2. Click again to change to the next smaller intraday time interval.
3. Right-click again to change to the next larger intraday time interval.
Example: Click twice on the <IntD> button to change a 60-minute bar chart to a 15-minute bar chart. The time interval sequence n is 1, 5, 10, 15, 30, and 60 minutes, and daily.
Note: Charts maintain their continuation settings when switched between daily and intraday using the <IntD> and <Hist> buttons.
The coloring along the horizontal axis for intraday charts that span more than one day indicates the different days covered by the chart. Additionally, the mouse text indicates the date of the selected bar.
Switches from an intraday to historical chart. This button is always displayed.
•Click or right-click the Hist button to change from an intraday time interval to the last used historical time interval.
•Click again to change to the next shorter historical time interval.
•Right-click again to change to the next longer historical time interval.
The time interval sequence for the <Hist> button is 60 Minutes, Daily, Weekly, Monthly, Quarterly, Semi-Annual, and Annual.
Charts maintain their continuation settings when switched between intraday and historical using the IntD and Hist buttons.