
Quote Board, a tabbed window, provides the open, high, low, last, and net change from the prior close.
Key:
P = settlement price
A = last ask price
B = last bid price
^ = up from previous trade or quote
v = down from previous trade or quote
underline = new high or low
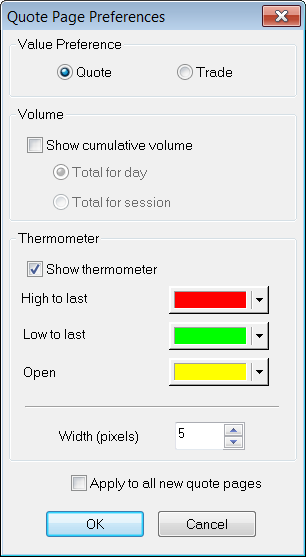
The thermometer provides a graphical representation of the current market standing relative to its opening, high, and low prices.
Symbols highlighted in red are not recognized. Symbols highlighted in yellow indicate delayed data.
You can add a colored border to Quote Board cells.
For details about the colors used on the Quote Board and to change those colors, go to Setup > Quote Board Colors.
To open Quote Board, click the Quote button, then click Quote Board.
Several quote windows (Quote Board, Last/Net Change, Market Watch, and Custom QuoteBoard) share some basic behavior.
Last/Net Change is a different view of the Quote Board. Click the LastNet button on the Quote Board to see this view.
This view shows the last trade price and net change from the prior close for the six most current contracts of a particular commodity. You can also show the last trade and net change for stocks and individual option series.
You can add a colored border to Last/Net Change cells.
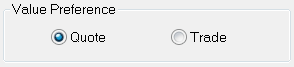
The only preference available for this window is Value Preference.
Market Watch is a different view of the Quote Board. Click the MWatch button on the Quote Board to see this view.
This view shows the last trade and net change for a single futures contract, option series, or stock.
You can add a colored border to Market Watch cells.
The preferences available for this window are Value Preference and Thermometer.