Spread bar returns bars for spread values.
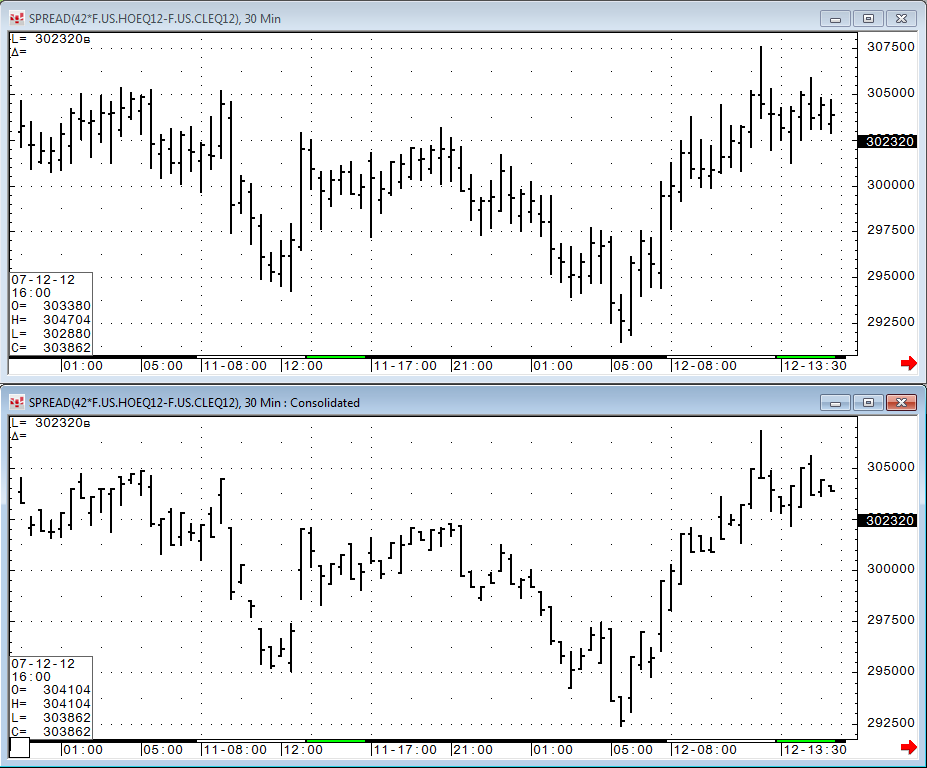
For example: Bar(42*HO-CL,1) when placed on a 5-minute chart, returns a bar which would represent the crack spread every 1 minute summed up over a 5-minute period. Normal display of a spread is a single line; this function creates a bar by taking the value at intervals smaller than the chart and creating a range.
On a bar chart, the bar interval is dictated by the interval selected for the chart. A spread bar chart allows you to set an interval, allowing more granularity.
Spread Bar Outputs
•SBOpen: Returns the Open value for the spread. (Formerly CBOpen)
•SBTrueRange: Returns the True Range for the Spread. True Range is the greatest distance of; 1) Current High to Current Low, 2) Previous Close to Current High, or 3) Previous Close to Current Low (Formerly CBTrueRange).
Spread Bar Parameters
|
Parameter |
Description | ||||||||||||
|
Display |
Opens sub-window with Color, MarkIt, and Display parameters. Color = Select colors for bars. MarkIt = Opens the Specify Conditions for Marking Bar window. Display = Choose line type: bar, line, or candle. | ||||||||||||
|
Interval |
Bar interval used to create the consolidated bars. Default = 1 min. | ||||||||||||
|
Max Check |
Turns on or off the Max Check function that restricts the Interval, depending on the chart type displayed when the study is applied. Without Max Check selected, it could take a very long time to consolidate one minute bars on an annual chart, for example. When Max Check is selected:
|