
Select the depth of market columns you want displayed in the DOM area.
•Depth of market (DOM) = displays combined DOM data (total volume size).
•Graphic depth of market (DOM-B) and Graphic cumulative depth of market (C-DOM-B) = show volume bars.
•Cumulative depth of market (C-DOM+ = aggregation of the DOM values below the best bid on the DOM ladder (useful when using sweep mode).
•Implied DOM (I-DOM) = price combined with spread prices.
The implied data (whenever available) comes from the exchange and are not calculated values: https://www.cmegroup.com/confluence/display/EPICSANDBOX/Implied+Orders
•Outright DOM (O-DOM) = outright of a single price
•AvgPrice: calculation = sum(askVolume*askPrice)/sum(askVolume) or sum(bidVolume*bidPrice)/sum(bidVolume)
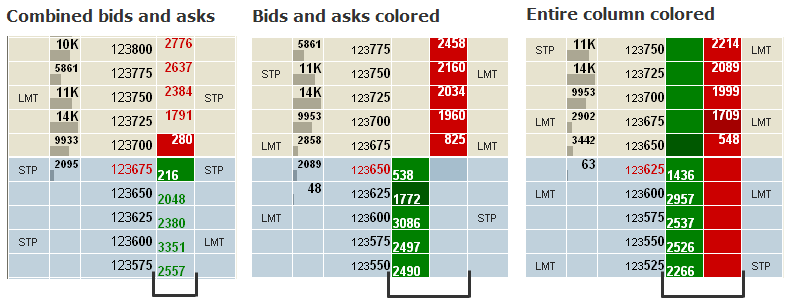
Choose whether to separate bids and asks and whether to color cells or not (only available with separate bids and asks).
Tooltips identify columns.