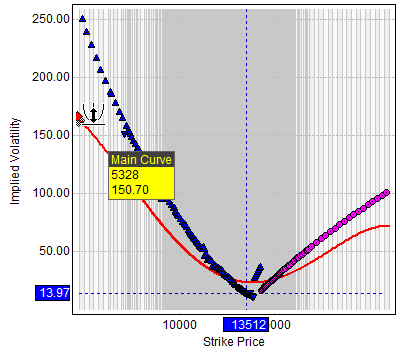
The VShape, HShape, Position, and Slope buttons add icons to the graph that you can use to manipulate the display of the curve. Drag the icon to change the graph shape.

As the VShape diamond is dragged, the number in the vertical shape row in the Modification table changes. Smaller numbers indicate the curve is getting flatter; higher numbers indicate the curve is getting rounder. The range of acceptable numbers is –200 to 200. You can also change this number directly in the Modification table.
As the HShape diamond is dragged, the number in the HorShape row in the Modification table changes. More negative numbers indicate the curve is getting skinnier; less negative numbers indicate the curve is getting fatter. The range of acceptable numbers is -200 to 200. You can also change this number directly in the Modification table.
As the Position diamond is dragged, the curve is repositioned as it maintains its shape. The horizontal shift variable moves the curve right (for positive numbers) or left (for negative numbers) by the designated price amount, scaled for price units. For example, entering 1000 for an S&P 500 option moves the curve right by 10 strike price units. However, the actual points do not change. The vertical shift variable moves the curve up (for positive numbers) or down (for negative numbers) by the designated percent. The horizontal and vertical shift parameters can also be changed directly using the Modification table.
As the Slope diamond is dragged, the number in the slope row in the modification table changes. You can also adjust the slope directly using the modification table.