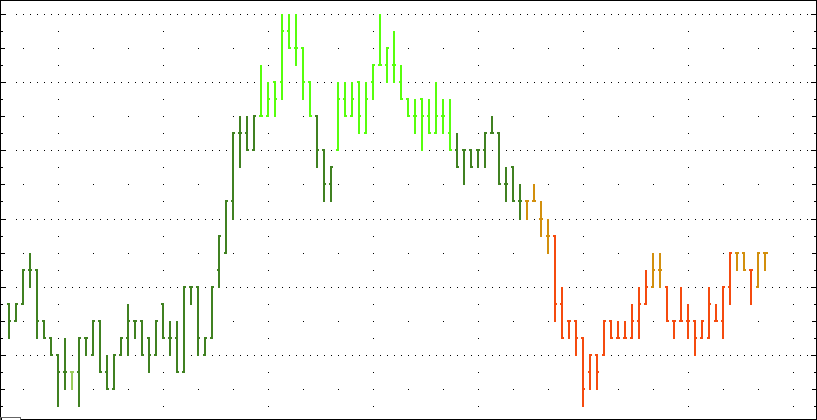
The ATM Heat Bar study is a data visualization tool representing current price’s proximity to the selected time frame’s ATM Target levels. The further price moves from the start of the trend the more intense the bar color.

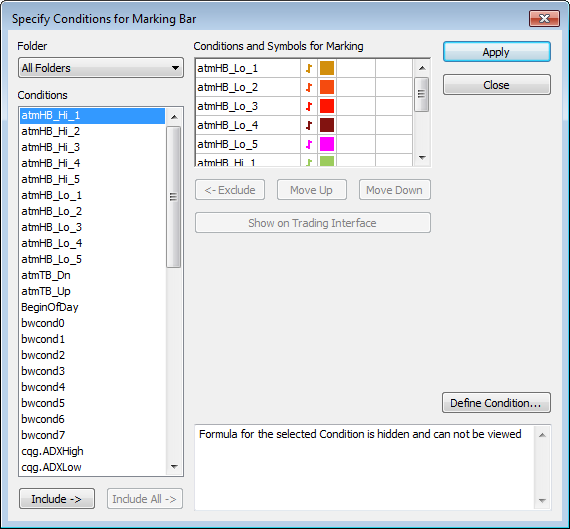
This study uses the ATM Target study output as conditions for marking bars. To change the display, right-click a bar, then click Select Conditions for Marking Bar.
