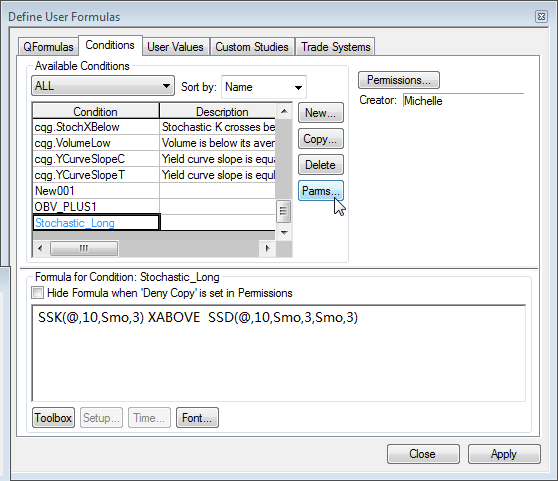
1. Create a new condition.
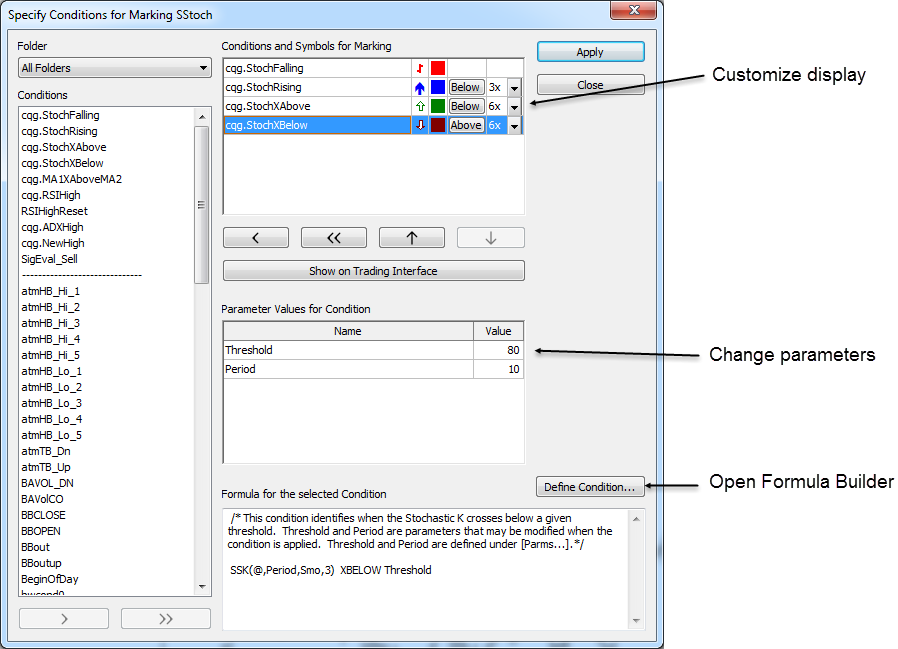
2. Choose studies using the toolbox. In this example, we inserted SSK, then used the Special menu to add XABOVE. Finally, we added SSD.
The formula is added to the list:
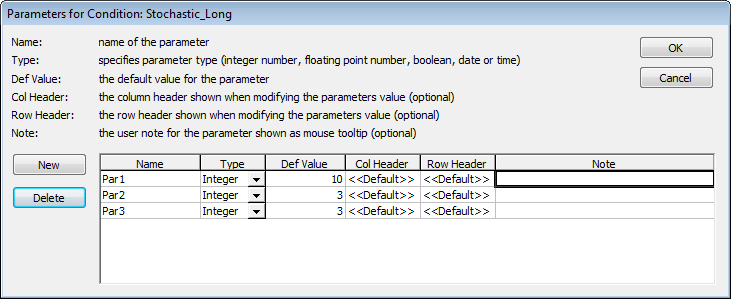
3. Create new parameters for the condition (click Parms button).
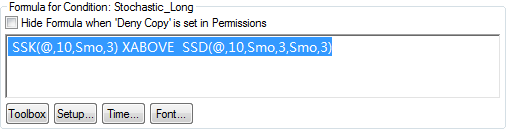
4. Change parameter values. Highlight the entire condition in the formula editor window:

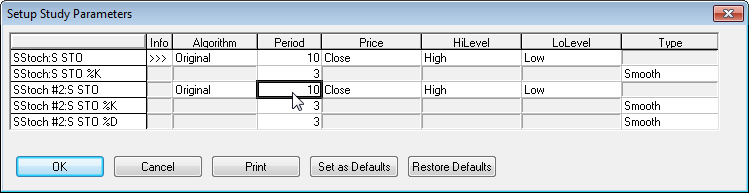
5. Click Setup.
6. Select new values.

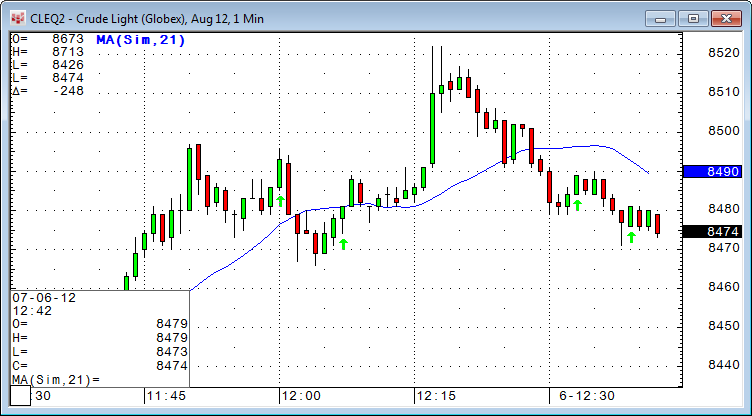
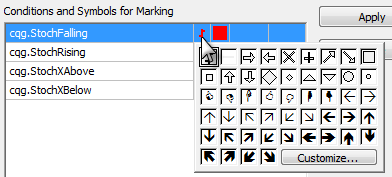
7. Add the custom condition to a chart. Right-click on a bar or candlestick chart, and click Select conditions for marking Bar/Candl. Choose a color and/or symbol to add to chart.
Results :