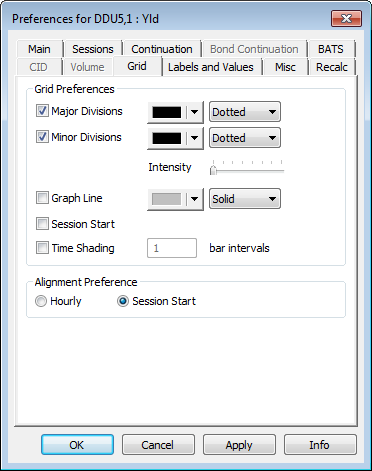
Grid settings apply to the lines and shading on charts. To access these settings, click Setup, then Chart Preferences, and then click the Grid tab.

Select Grid Display Settings
Choose to display major division, minor division, and graph lines and whether those lines should be solid or dotted.

The Intensity slider allows you to brighten or dim the grid lines.
Major and minor divisions are calculated as:
|
Chart Interval |
Major Division |
Minor Division |
Graph Line |
|
1-Minute |
30 Minutes |
15 Minutes |
Vert. Line 1/min |
|
5-Minute |
Daily |
2 hours |
Vert. Line 1/5 mins |
|
30-Minute |
Weekly |
Places the study on top of another display. If the box is not selected, the study is based on the chart or study indicated in the Applied To box, but it is in a separate window. |
Vert. Line 1/30 mins |
|
60-Minute |
Weekly |
Daily |
Vert. Line 1/60 mins |
|
Daily |
Monthly |
Weekly |
1/day |
|
Weekly |
Yearly |
Monthly |
1/week |
|
Monthly |
Every 4 years |
|
1/month |
|
Quarterly |
Every 4 years |
Every 2 years |
1/quarter |
|
Semi-Annual |
|
Every 2 years |
2/yr |
|
Annual |
|
Every 2 years |
1/yr |
The frequency of the horizontal lines depends on the scale of the vertical axis.
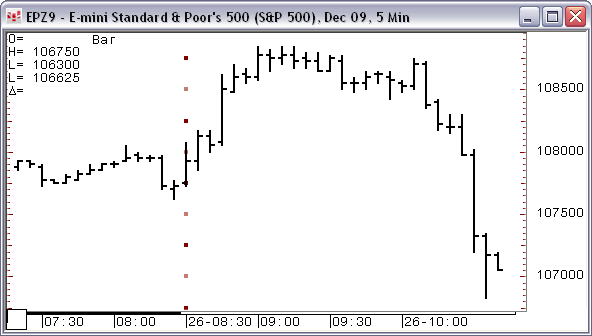
Display Session Start
Click the Session Start check box to include a vertical line at the session start. This line picks up the colors and intensity from the major and minor divisions settings.

Set Time Shading

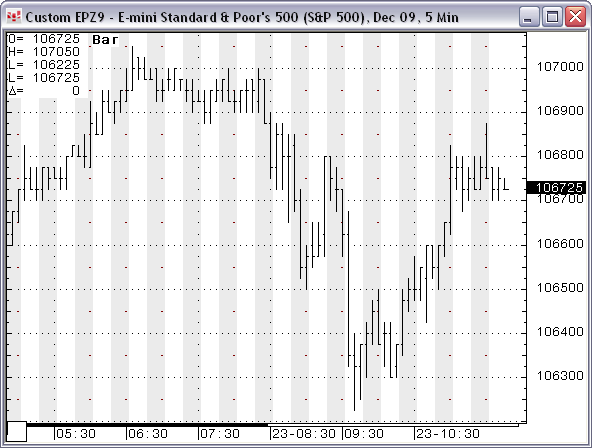
Select the Time Shading check box to shade increments of time on a chart, like this:

Enter the increment in the bar intervals field.
This shading is off by default.
Choose Alignment

Choose whether the gridlines are geared to clock hours or to the session start. This feature is particularly relevant to contracts such as the Japanese Yen or any contract where the trading session does not start on the hour.