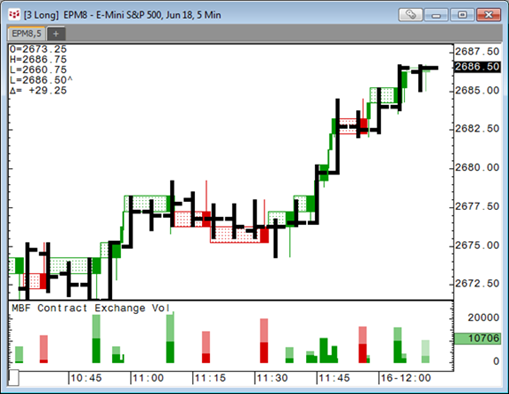
This study from Mark B. Fisher has two parts: Renko-style bricks drawn on a variably-scaled, time-based chart and Fisher bars displayed below that chart. These volume bars have different durations than bricks, so each bar can correspond to several bricks and vice versa.
MBF can be used only with intraday charts. You can also open a bar chart with this study applied automatically using a Mark Fisher chart.
Charting starts at the session open. If can be applied to regular symbols but not to their inversions or to synthetic strategies and other complex expressions.
You can specify conditions for MBF.
This study cannot be used with trading interfaces, monitors, or quote boards.
MBF requires an enablement.
Bricks
Bricks show the duration of the price range movement. The height of the brick shows the range of prices, and the width of the brick shows the length of time it took to realize that range.
The price range can be specified in ticks or notional value, for example, 1 tick or $0.25 (Brick Unit parameter).
A new brick is started each time the price range is exceeded in either direction. A brick is not fully drawn until it is completed; that is, a new brick isn’t drawn until the price range has been exceeded.
Positive price movements are represented by green bricks, while negative are red. You can change the colors (Display Brick, Color parameter).
Each brick has two components: a shaded area that marks the full span of time and an optional solid bar (stripe) at the end of the timespan (Display Brick, Stripe parameter). The stripe corresponds to the volume bar.
Bricks also have optional wicks (Display Brick, Wick parameter). The wick identifies the actual price range during the duration of the brick.
A brick in progress is drawn as a hollow brick. If the trading session ends before a brick can be completed, it remains hollow. If the market direction of a hollow brick cannot be determined, its color is determined by the Display Brick, MBF Color parameter.
Null bricks
Null bricks are created to fill price gaps and have no actual trade volume. You can suppress the generation of null bricks (see Max Null Brick parameter).
Renko chart users should note that null bricks are displayed differently for MBF bricks.
Both combined (Max Null Bricks=0) and uncombined (Max Null Bricks>0) null MBF bricks are displayed as a vertical dotted line left-aligned to the next non-null MBF Brick (a brick with actual traded volume). The color of null MBF brick is the same as the color of the next non-null MBF brick:
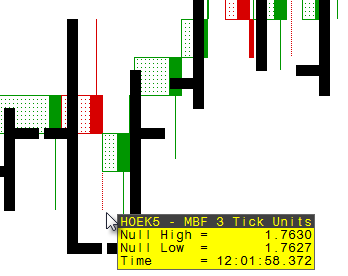
The tooltip for null bricks provides null high and low and time of brick rather than the outputs for non-null bricks.
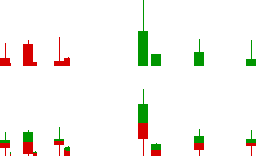
Fisher bars
Fisher bars show volume corresponding to the time at which the price was within the tick range (versus wicks that show when the price was outside the tick range). The bars are right-aligned, so that they line up with the price bar.
Fisher bars inherit their color from the corresponding brick. Total volume is displayed in one color, either up or down. Bid/ask volumes are drawn in two colors, both up (ask) and down (bid). For bid/ask volume, see also the Display Volume, Stacked parameter.
Fisher bars, like bricks, can have optional wicks. The display of wicks is determined by the Display Volume, Volume parameter.
These volume bars are optional (Display Volume, Volume parameter). You can choose the volume displayed: either exchange or tick and either total or bid/ask (Display Volume, Type and Volume parameters).
Outputs
Outputs are not displayed in the cursor value box, on trading applications, on monitors, or on quote windows.
Hover the mouse over the study curves to see:
•MBF High
•MBF Low
•Wick High
•Wick Low
•Start
•End
•Duration
For null bricks:
•Null High
•Null Low
Hover the mouse over the Fisher bars to see:
•Volume
•Start
•End
•Duration
The volume value depends on the volume display setting:
•Total = total volume
•Total, Wick = total volume and volume @wick
•Bid/Ask = total volume, bid volume, and ask volume
•Bid/Ask, Wick = total volume, bid volume, ask volume, bid volume @wick, and ask volume @wick
MBF parameters
Parameters for brick curve (MBF) and volume curve (MBF: Vol)
|
Parameter |
Description |
|
Brick Unit |
Select Tick (default) or Price to specify the units bricks are measured in. |
|
Brick Size |
Used with brick units. Specify brick size. Default = 5. (The default size for Mark Fisher charts is 25.) Consider EP. The minimal price change of 1 tick is equal to a $.25 change in the display price. So, Price = 25 is the same as Tick = 1. |
|
Max Null Bricks |
Specify a maximum number of null bricks that can be generated as a single brick in the case of price gaps. If the number of null bricks to be generated due to a single price change is greater than this value, then all null bricks are combined into a single brick. Valid values: 0-200. Default value is 0, which means that the chart will not show any null bricks and will combine all null bricks into the current one. A value of 200 means that all null bars are generated unless the number of null bars is greater than 200. The timestamp of a null brick is equal to the timestamp of the previous brick. This guarantees that the brick has the same timestamp no matter what this parameter is set to. |
|
Display: Brick |
Opens a sub-window to set parameters for MBF, MBF: Up, and MBF: Down •Color = Brick color. (MBF = hollow bricks) •Opacity = Transparency of brick shading. Default = 1. Maximum value = 5. •Weight = Brick thickness. Default = 0.1. Maximum = 3. •Wick = Select a location for the wick on the brick: Off, Center, or End of Bar (default). •Stripe = Turns the brick stripe on (default) and off. The stripe corresponds to the associated volume bar. |
|
Display: Volume |
Opens sub-window to set parameters for MBF: Total. •Type: Select Exchange, Tick, or Auto (default) •Volume: Select Off; Total; Total, Wick (default); Bid/Ask; or Bid/Ask, Wick. Off = hides the volume display at the bottom of the chart •Stacked = Used only for Bid/Ask volumes. When on (default), bid/ask values are stacked from the bottom up. When off, bid values are displayed above the median and ask values are displayed below the median. •Wicks = Used only for wick volumes, determines the width of the wick. Select Rect (default) or Line. Rect = the width of the volume bar. •Width = Select Stripe (default) or Relative to Bar. Stripe corresponds to the brick stripe, while Relative to Bar is the width of some percent of the bar. •Percent = Used with Width = Relative to Bar. Default = 75. •Center = Turns centering on and off (default) |