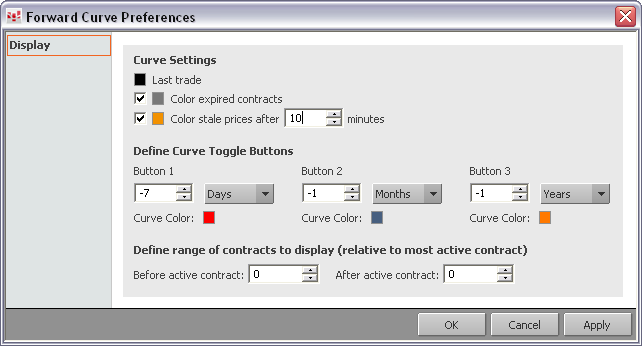
Both curves have the same preference options. To access these settings, click the Setup button, and then click Curve Preferences. You can also open the preferences window by right-clicking the curve window title bar and selecting Curve Preferences.

To change trade, contract, and price display
You can choose to display expired contracts and stale prices. You define a stale price by selecting minutes of inactivity.
To change the color of the last trade, expired contracts, or stale prices, click the colored square to open the standard color palette.
To configure the curve buttons
Here, there are two preferences to set: the color of the curve line and how many days, months, or years in the past the curve represents.
To change the color, click the colored square to open the standard color palette.
To change the time frame, use the arrows to move the number up or down, and click the arrow to select Days, Months, or Years from the menu.

When you open the curve window, it is automatically populated with instruments. How many instruments is determined in preferences.
The Before active contract value determines the number of contracts before the current contract. The After active contract value determines the number of contracts after the current contract.
You can also enter a symbol and range directly. The format is: symbol[low bound:high bound]. For example, EP [-1:2], where -1 and 2 are number of contracts being stepped from the most active one. You can also use a comma or semi-colon to separate the bounds.