Chart and study data can also be viewed in a table. Right-click the print button, then click Tabular Display.
The data displayed in the table depends on the chart’s outputs and the studies that have been added. For example:
|
Chart Type |
Data |
|
Bar, Candlestick, MBF, Range Bar |
date, time, OHLC |
|
CVB |
date, time, OHLC, TickVol, Vol, AskVol, BidVol |
|
Heikin-Ashi |
date, time, OHLC, TrdO, TrdH, TrdL, TrdC |
|
Line |
date, time, C |
|
P&F |
date, time, HL |
|
Renko |
date, time, HL, RenkoHigh, RenkoLow |
|
Sub-Minute Bar |
Date, Time, OHLC, Range, TrueRange, TickVol, Vol |
|
TFlow |
date, time, OHLC, AV, BV, AvgCompr, TrueHigh, TrueLow |
|
Tick |
date, time, tick |
Tabular display is not available for Market Profile charts.
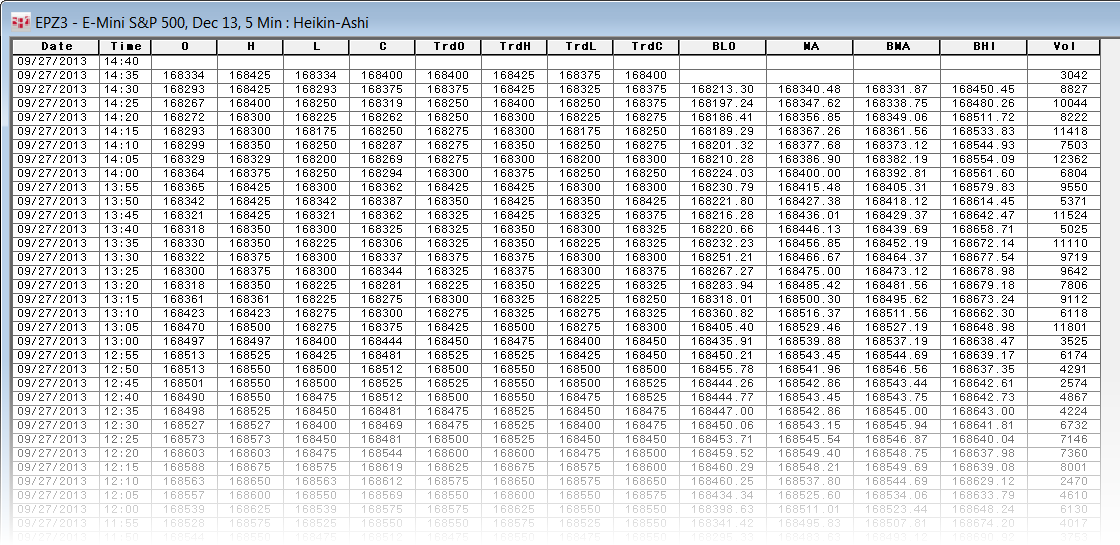
In this image, Moving Average, Volume, and Bollinger Bands have been added to a Heikin-Ashi chart:

This view of chart and study data is especially helpful if you want to incorporate the data in a spreadsheet. Select, copy, then paste the data into Excel.
Tabular Display Toolbar
|
Button |
Description |
|
Ascnd |
Sorts time in ascending order. |
|
Dscnd |
Sorts time in descending order. |
|
Long |
For point and figure only, shows the high and low for each bar in separate rows. |
|
Short |
For point and figure only, shows the high and low by minute and not by bar, so that those prices that occur at the same time are displayed in additional price columns. |
|
Bar-Based |
For point and figure only, displays PFHigh, PFLow, PFMid, and PFUp. |