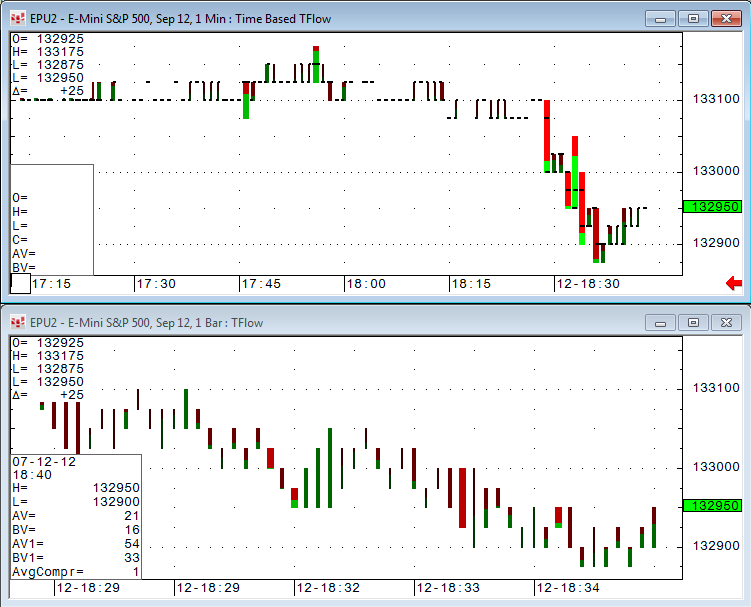
The Time-Based TFlow chart displays bars built based on Time & Sales data similar to regular time bars, but with the addition of bid and ask volume. Bid and ask volume is available intraday only. This chart also provides access to historical data.
Time-based bars appear as TFlow bars with open and close markers.
The bid volume is represented by the red part of the bar, and the ask volume is green. The color brightness and the width of Time-Based TFlow bars are based on the current bar’s volume relative to the volume history. The preferences offer four preset colors/widths. The higher the volume then the brighter and wider the bars.
You choose one of three ways to determine the current bar’s volume relative to the volume history: percent ranking, percent of average, and actual. These values are explained in parameters.
TTFLow charts can be used with the same contracts and studies that you use with a regular time bar. You cannot use order book analytics or volume studies. Volume information is not displayed if time and sales trade volume is unavailable.

Time-Based TFlow Outputs
The cursor value box, QFormulas toolbox, mouse tool tips, and tabular display contain these outputs:
•Open
•High
•Low
•Close
•AV = Ask trade volume
•BV = Bid trade volume
Time-Based TFlow Parameters
|
Parameter |
Description |
|
MarkIt |
Opens the Specify Conditions for Marking Bar window. |
|
Volume Threshold |
Choose Percent of Average, Percent Rank, or Actual. Percent of Average: The four sets of colors/widths are based on the current bar’s volume relative to a percentage of the average of the previous same session volume: 0 = Volume is above and up to and including the previous session’s average volume times zero percent. 10 = Volume is above and up to and including the previous session’s average volume times 10 percent. 50 = Volume is above and up to and including the previous session’s average volume times 50 percent. 90 = Volume is above and up to and including the previous session’s average volume times 90 percent. If the previous session average volume is not available, then the percent values are treated as actual volume values. Percent Rank: The historical volume over a preset look-back period is ranked by size from the smallest to the largest. The current bar’s color/width is determined by which of the four percentile rankings of the distribution of the volume history the current volume reading lands in. The default range of the percentile rankings are: Zero, up to 10 percent 10 percent up to 50 percent 50 percent up to 90 percent Greater than 90 percent Actual: The four sets of colors/widths are based on the current bars volume being greater than a traded volume level, e.g., greater than 5,000 contracts. The preference's threshold parameters are set traded volume levels and the bar’s volume is compared to them directly. For example, the levels could be set to 1,000, 5,000, 10,000, and 25,000 contracts (each level marks a range greater than and up to the next level). If the current bar’s traded volume were 7,500 contracts, then the color/width would be based on the second group (5,000). |
|
BVol |
Color for bid volume bars for each size of bar. |
|
AVol |
Color for ask volume bars for each size of bar. |