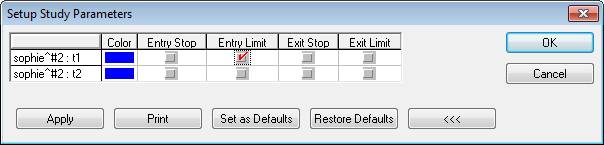
Click the Trades in Trades column. You can check the check boxes to display on the chart your Entry Stop/Limit and Exit Stop/Limit.
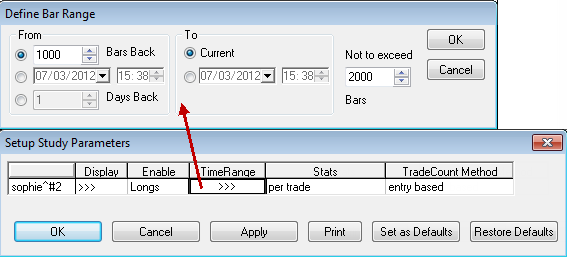
To edit Bar Range & Changing Trade Colors
Click the in TimeRange column to edit Bar Range & Changing Trade Colors.
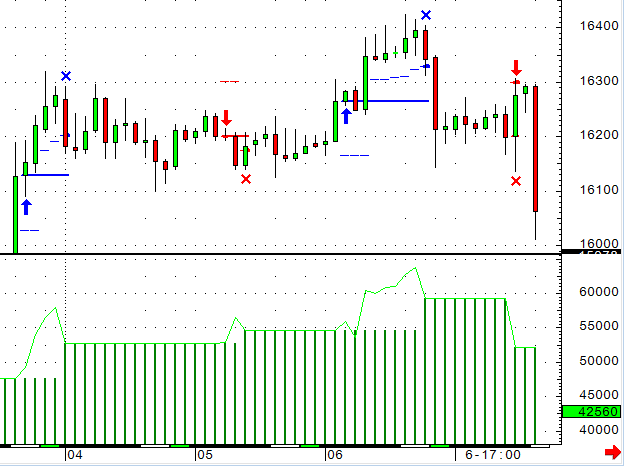
To chart signals
Trades can be identified by:
•Up/down arrows showing the opening of the trade
•Horizontal Lines linking the opening price with the exit bar
•Crosses showing the exit bar
•Ovals standing for the exiting price
•Dashed line showing the entries - exits limit / stop orders
To export trade system results
There are two different kinds of information you can export or print, when the trade system is applied on the chart:
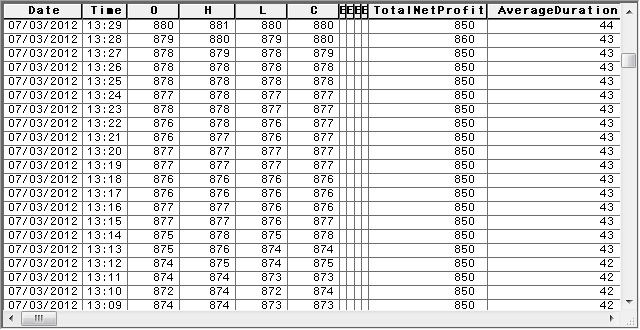
Trade systems statistics per bar taking as reference point the total net profit values.
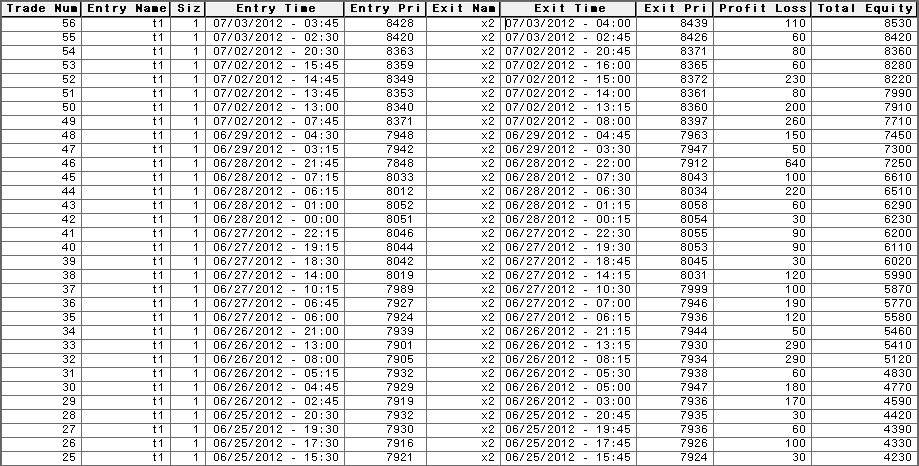
Analysis of closed trades, taking as reference the Closed Net Profit value. In this analysis, you will see how many trade have been opened and closed, which type of exit has been used, the entry and exit price, time, etc.
Tools are as follows.
Tabular display:
Tabular trades :
You can call up one of these at a time with a right-click on the printer button (on the top left of CQG screen).
CQG also allows you to export your results to a Microsoft Excel spreadsheet:
1. Right-click the Printer button.
2. Select Tabular Display.
3. Highlight all the data in the table and then press CTRL + C to copy the data into the clipboard.
4. Open a spreadsheet.
5. Press CTRL + V to paste the data into the spreadsheet.