What it does
Trend lines indicate a persistent change in price, either upward or downward. More precisely, in an uptrend, the lower limits of the fluctuation tend to form a straight line, and in a downward trend, the upper limits conform to a straight line.
When trend lines are on a chart or being placed on a chart, the mouse text box contains the following additional items:
|
P |
Indicates the position, on the price scale, of the pointer. |
|
T |
Price shown on the trend line at the time of the bar. |
|
S |
Change in price per day. Therefore, for bars shorter than daily, the slope is multiplied by the number of bars of the selected time frame in one trading day. |
How it works
1. Right-click the chart, point to Pointer Tools, then click Trend. The cursor becomes a pencil.
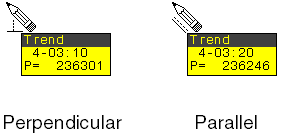
To draw a perpendicular line, press CTRL before you begin.
To draw a parallel line, press SHIFT.
Notice the cursors:
2. Click the chart to establish a starting point.
3. Move the cursor to the desired angle, and click to park it.
To draw a line parallel to existing trend line
Right-click the existing trend line, then click Draw Parallel to Trend.
To add a trend line to another pointer tool
You can draw parallel and perpendicular trend lines (Trend and Trend Channel pointer tools) in relation to other pointer tools also.
For parallel lines, click the pointer tool line on the chart, then click Draw Parallel to <tool>. You can also hold down the Shift key.
For perpendicular lines, hold down the Ctrl key.
To display the angle of the trend line as you draw it
1. Draw a trend line.
2. Right-click the line, and then click Modify Trend.
3. Click the Display field for the second point.
4. In the Angle field, choose left or right, which indicates that the angle is displayed to the left or right of the trend line.
5. Click Set as Defaults.
6. Click OK.
Now, each time you draw a trend line, the angle is displayed, making it easy to draw the line at the angle you want.
If you would rather specify the angle, go to parameters and change the Use field selection to Angle and enter a value in the Angle field.
Trend parameters
Each trend line has a start point (Pnt1) and an end point (Pnt2).
T1:Pnt2
|
Parameter |
Description |
|
Use |
Select Angle or Point. Choose Angle when you want to specify the angle of the line (in the Angle field) regardless of the end point value. Choose Point when you want to use the bar and its value to dictate the angle. |
|
Value |
Choose Open, Close, Low, or High for the start or end point of the trend line. |
|
Current Bar |
If selected, then each time the current bar moves, the trend line is redrawn. |
|
Date |
Identifies the date at the location of the tool. |
|
Time |
Identifies the time at the location of the tool. |
|
Angle |
Specify the angle for the trend line, when Use = Angle. |
|
Display |
Opens sub-window with display parameters: Color = Select color of line. Weight = Select thickness of line. Angle = Off = not displayed, Left = displayed to left of line, Right = displayed to right of line. Id = Turns on and off the labels Text Weight = Select thickness of text. Style = Select a line style: line, dash, or dots. |
T1:Pnt1
|
Parameter |
Description |
|
Value |
Choose Open, Close, Low, or High for the start or end point of the trend line. |
|
Date |
Identifies the date at the location of the tool. |
|
Time |
Identifies the time at the location of the tool. |
|
Display |
Determines the direction and length of the line. Options include: Pnt1-Pnt2 -> (from point one and all the way right) <- Pnt1-Pnt2 (from point two and all the way left) Pnt1-Pnt2 (between points one and two) <- Pnt1-Pnt2 -> (all the way left and all the way right) Pnt2 -> (from point two and all the way right) <- Pnt1 (from point one and all the way left) |
|
ScaleLabel |
Select this check box to color-code the price scale according to the trend line. |