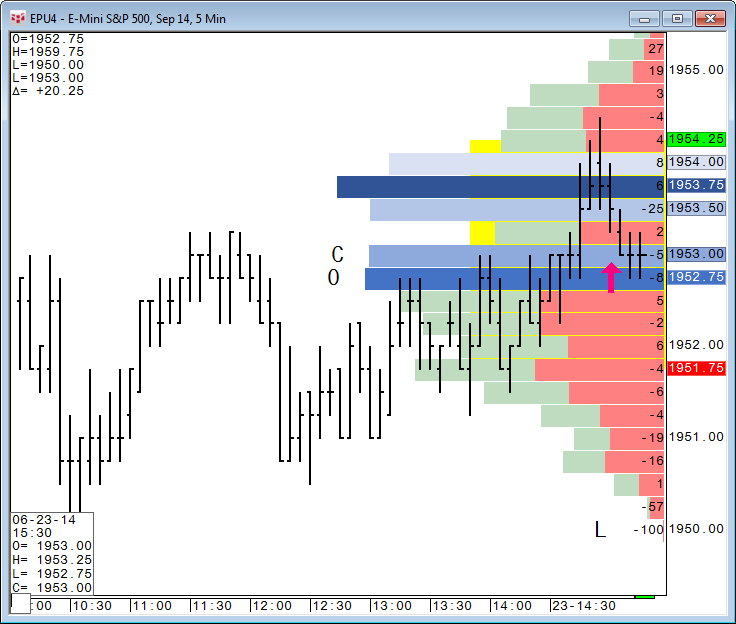
The Volume Profile study displays either:
•volume distribution (Total Volume)
•bid and ask distribution (Bid/Ask)
•distribution of difference between bids and asks (Bid/Ask Delta)
The distribution type is selected using Highlight preferences.
This study allows user to analyze prices with the most trades on each side of the market.
Consideration of buying and selling pressure could improve turning point forecasting, and analysis of buy and sell trade imbalances could lead to greater precision in detecting market direction.
Volumes can be represented as ticks or as exchange volumes.
You can think of it as the analog of the graphic volume presentation in Market Profile.
The study can be used with both historical and intraday charts. This overlay study is available on all charts except SpreadBar and Market Profile. More than one profile can be applied to the chart at one time.
If this study is part of an analog study, then volume is shown for the foreground symbol only
The Volume Profile study can also incorporate Delta Bar information.
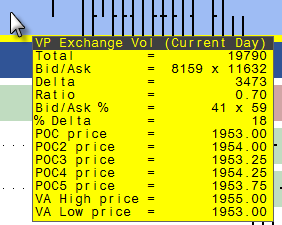
Hovering the mouse over the display opens a tooltip with comprehensive volume data:
•Total volume
•Bid and ask volume
•Delta = difference between bid and ask volumes
•Ratio = ratio between bid and ask volumes (shows two digits after decimal)
•Bid/Ask % = Bid Volume/Total Volume * 100 x Ask Volume/Total Volume * 100
•% Delta = (Ask Volume - Bid Volume) / Total Volume * 100
The font used in this tooltip is controlled by Horz & Vert Scales in Chart Fonts, the default of which is set to the maximum size. The minimum size is 7. The font size will be adjusted automatically if the data is too large for window. If the font is 7 and still too large, data is not displayed. Font color is inherited from right and left scale text.
If you have overlapping volume profiles on the chart, hovering the mouse over the profile exposes all values.
Contact CQG to be enabled for this study.
Volume Profile Parameters
|
Parameter |
Description |
|
Type |
Volume type. Values: •Exchange Only = total number of contracts traded during the selected chart interval •Tick Only = number of inside price changes, i.e. count of how many times last price has changed over a time period. •Exchange or Tick = exchange volume is used if available, otherwise ticks are used. |
|
Highlight |
Select a distribution type. Values: •Total Volume = volume distribution for prices •Bid/Ask = bid and ask distribution for prices •Bid/Ask Delta = distribution of difference between bids and asks •Delta Profile = profile based on delta volume absolute values and colored according to bid and ask colors •Bid Only = bid data only and colored with bid colors •Ask Only = ask data only and colored with ask colors |
|
Color |
Opens sub-window to set parameters •Heatmap = colors volume bars according to strength •Total = color for total volume •Asks = color for asks •Bids = color for bids for •Total Volume •Bid/Ask •Bid/Ask Delta |
|
Start Time |
Opens sub-window to set start time: •Current session •Current day •Custom session (if unavailable, current day is used) •Date/Time, used with Date and Time parameters •Days back, used with Days back parameter (maximum number of days back is based on intraday data enablement value) |
|
Display side |
Side of chart to display volume on, right or left. |
|
Fit Cell |
Used when Display Side = Auto. Allows the profile to span the entire profile area. |
|
Width (%) |
Distance volume profile bars extend across the chart. Minimum = 1. |
|
Share Width |
If you have more than one volume profile applied to the chart, bars are displayed one after the other. If you select Share Width, the volume profiles overlap instead. |
|
Display |
Opens sub-window to set these parameters: •Display •Color •Length •Weight •Param (Bars: Redistribute, VA: % Dist, Vol Nodes: Sensitivity, POC: POC Distance for these elements: •Bars •Value Area •POCs 1-5 •POC Marker •OHLC The following tables provide additional details. |
Display: Bars
|
Parameter |
Description |
|
Display |
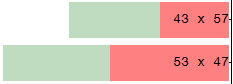
Indicates the label to be displayed. Values: •None •Total •Bid/Ask •Delta •Ratio •Bid/Ask % •% Delta Example: Bid/Ask Percent
|
|
Param: Redistribute |
Select to aggregate the data when the price axis is made smaller.
|
Display: Value Area
Value Area is a variable range in which 68% (default distribution) of the volume occurs.
|
Parameter |
Description |
|
Display |
Values: •None •Solid Line = two solid lines, displayed over histogram bars at their prices, corresponding to low and high levels of value area •Dash Line =Two dashed lines displayed over histogram bars at their prices, corresponding to the low and high levels of value area. •Area = Top border corresponds to the high level of value area and bottom border to the low level of value area. Displayed in the background of histogram bars. Scale label colors correspond to Value Area and High and Low. |
|
Color |
Select colors for high, low, and area. |
|
Length (%) |
A line starts where the VP bar starts, and its length is this percent of the chart. |
|
Weight |
Select thickness of lines.. |
|
Param: % Dist |
Determines the range of value area: n % of the volume occurs within this range. |
Display: Vol Nodes
|
Parameter |
Description |
|
Display |
Select a line style: •Fill •Outline •None |
|
Color |
Select line color. |
|
Weight |
Select thickness. |
|
Param: Sensitivity |
Determines sensitivity of the volume nodes detection of high volume and low volume. Default = 10 Range = 1-999 |
Display: POCs
POC is calculated as price with the maximum total volume on a volume profile period.
|
Parameter |
Description |
|
Display |
Select a line style: •Fill •Solid Line •Dash Line •Outline •None When displayed as a line, tooltip with price of POC is available. When displayed as an outline, the horizontal cursor line has priority. When filled, color overrides highlight color |
|
Color |
Select line colors. Scale label has POC prices in corresponding colors. |
|
Length (%) |
A line starts where the VP bar starts, and its length is this percent of the chart. |
|
Weight |
Select thickness of lines.. |
|
Param: POC Distance |
Distance between different POC levels in ticks. |
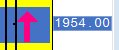
Display: POC Marker
Marks bar at the most recent POC price change.
|
Parameter |
Description |
|
Display |
Select the check box to display the arrow marker. The marker is displayed initially when the POC price changes.
If POC increases, up arrow positioned below the bar If POC decreses, down arrow positioned above the bar |
|
Color |
Click to change color. |
|
Weight |
Type a value to increase or decrease the size of the marker. |
Display: OHLC
Highlights bars based on open, high, low, close prices of current trading day
|
Parameter |
Description |
|
Display |
Values: •None •Letter (O, H, L, C), color determined by scale text color •Arrow Example: Arrow
When more than one profile is displayed on the chart, letters have priority over arrows when letters and arrows fall at the same price. |