
If you have chosen more than one chart type, then multiple tabs are displayed in the results area.
In this example, the Combined window shows the results of both the Bar and CVB combined. Only one symbol (DFAM9) passed the same condition for both chart types.
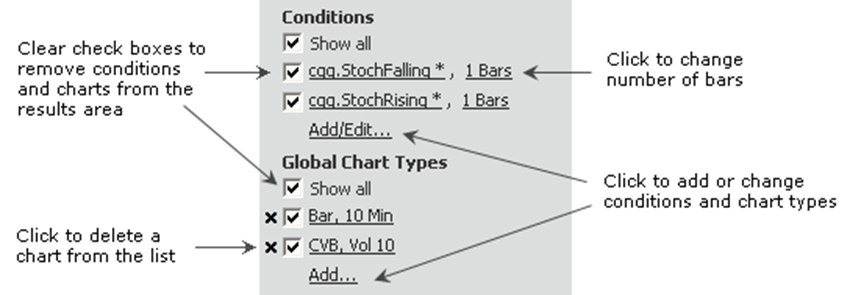
Once the results are displayed, you can change that display. You can also make changes to the scan to run it again.
To open a chart from Market Scan

1. Hover the mouse anywhere on the row for a particular symbol. Notice the cursor changes to display a chart icon.
2. Click. A chart for that type, interval, and symbol opens.
To export Market Scan results
It’s easy to save scan results to a spreadsheet, the clipboard, or an HTML file.
1. Click the Export button on the Market Scan toolbar. The Export Market Scan Results window opens.
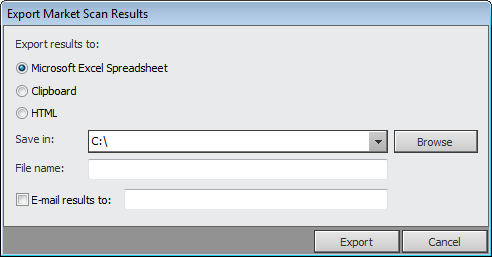
2. Click the button for the type of file to export to.
3. Click the Browse button to select the location to save the file to.
4. Enter a file name.
5. To e-mail the results, click the E-mail check box and enter an email address.
6. Click Export.
The Market Scan Save window also has an Export Results button.
Click the Save button on the Market Scan toolbar. The Market Scan Save window opens.
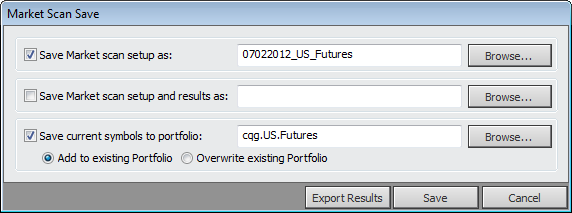
•To save the setup of the scan, click the first check box and enter a name. Click the Browse button to show previously saved setups.
•To save the setup and results of the scan, click the second check box and enter a name. Click the Browse button to show previously saved setups/scans.
•To edit a portfolio to include the current symbols, click the third check box. Click the Browse button to show previously saved portfolios.