P&L Graph
The P&L graph shows the at-expiration and current profit and loss curves. The display also shows highlighted boxes on the X- and Y- axes, indicating the current underlying price and the resulting profit or loss.
Greek Graphs
Delta, gamma, theta, vega, and rho curves can be displayed. Each curve can be shown with respect to underlying price, days to expiration, volatility, and interest rate. X-axis variables are selected in Plot strategy parameters.
Time Value Graph
Time value is calculated by taking the value of the strategy at the end of each day and subtracting any intrinsic value.
Table Graph
The table graph shows the value of profit and loss for every strike price. WhatIf columns, if applicable, are also displayed.
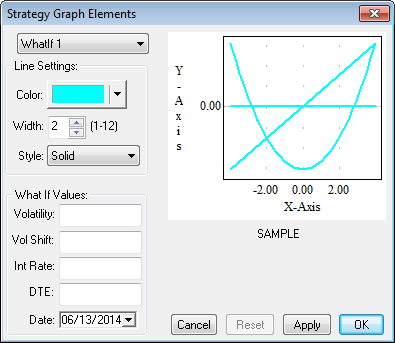
Selecting Strategy Graph Elements
The Strategy Graph Elements window is used to change the strategy graph color elements. There are two versions of the window. The version depends on how you open the window.
If you open this window by clicking the Setup button, then clicking Change Graph, you can change the color, width, and style of the lines on the graph.
If you open this window by clicking the Color field in WhatIf parameters, you have additional options: volatility, vol shift, int rate, DTE, and date.