Benefit from Shaun Downey’s three decades of trading experience across all financial markets.
In 2007, Downey published his book, Trading Time, to great praise within the industry. These twenty-nine proprietary studies based on his work analyze time by referencing each part of the day to its previous behavior at similar periods. In this way, Shaun has created a true measure of momentum, allowing for fixed reference points that understand normal and unusual behavior in multiple time frames at the same time. Traders no longer have to wait for the current bar to finish before implementing trades, as many of the studies reference the opening price, and not the close, unlike many established momentum-based concepts.
His studies also help traders identify trends within their infancy, in time frames as low as 5 minutes, and how to ride the trend to its conclusion many months later.
Downey’s studies also look at the various methods around Peak steps, which provides new concepts of swing theory, trailing stops, when trend corrections are due, and when the trend is strong and needs to correct but will restart. Traders can quantify swing patterns by connecting them with time, range, and volume.
Commentary by Shaun Downey
The Downey suite of studies quantify many technical scenarios but one of the more popular strategies is linking limits of range for the trading day, and connecting this with the limit of range on multiple timeframes for a specific time of that day. These levels present optimum points for profit taking on trend following trades and also provide low risk counter trend opportunities. The various divergence based concepts can then be added for additional confirmation or subsequent fresh trend following positions. The recent low in the S&P after weeks of selling is a prime example of the ability to trade with high volume as risk is so tightly defined in spite of the increased volatility.
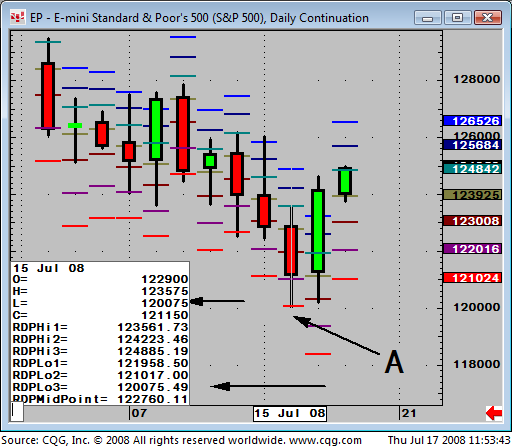
The four charts highlight how the studies combine. The first chart shows a daily S&P and uses the Range Deviation Pivots. These have an inbuilt volatility skew that means in trends risk is tightened against the trend and widened with it. The 3rd deviation represents the normalized trend skewed limit of range for the day. Point A shows that the limit was 1200.75 and this proves to be the low of the day to the tick.
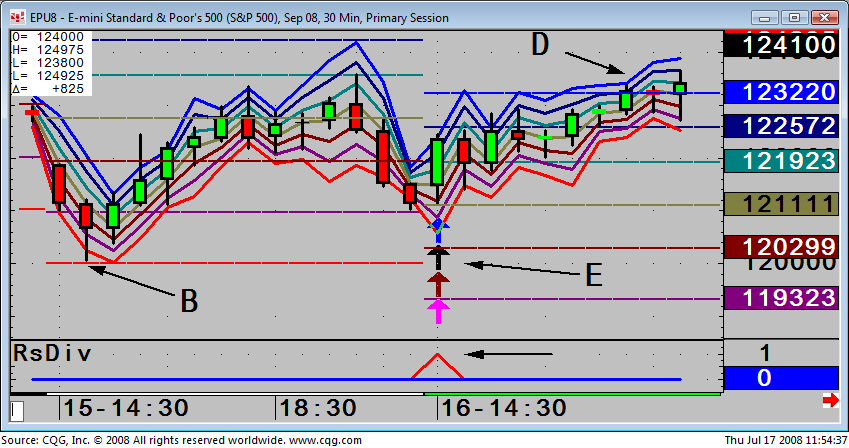
The second chart is a 30 minute and uses the Volatility Time Bands with compute 1, 2 and 3 deviations around the opening price and quantify what is normalized and extreme behavior for that specific time of day. At point B the 3rd Band represents that limit and when is combined with Range Deviation daily limit, provides a low risk opportunity.
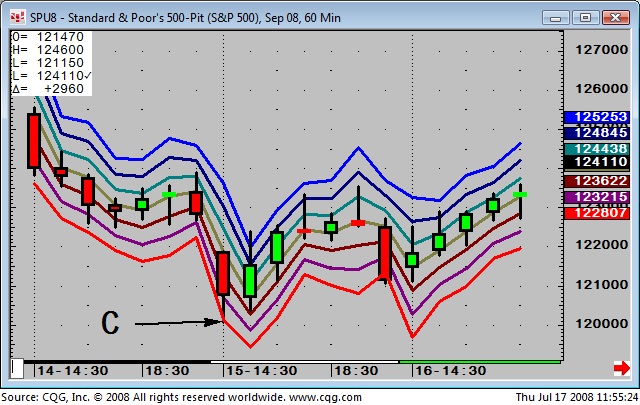
The third chart shows the power of multiple timeframe extremes as at Point C the 60 minute is also at the 3rd Deviation that was at Point B in the 30 minute chart. All three separate timeframes are all signaling an extreme at the same time.
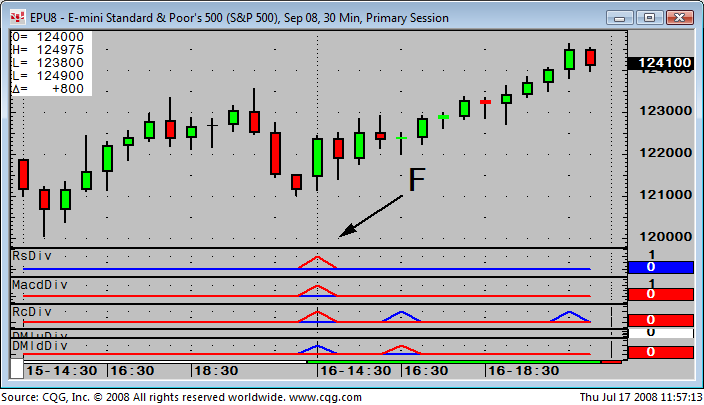
The second and fourth charts at Points in E, D and F highlight the combination of divergence entry’s and then the optimum exit point for a day trade. The 4 arrows at Point E are multiple divergences placed through the Rsi. The pattern does not reference absolute high lows for quantifying divergence, but looks for divergence through a variety of relationships beyond that, such as the High/Low/Close divided by 3 and looks for multiple pattern synergies on the same bar. This means that divergence can be signaled not just against the trend, but in sideways, thereby signaling an imminent break out, or as divergence as a continuation of the existing trend.
The 4th chart at Point F shows that a whole range of difference studies are all diverging at the same point as the multiple pattern Rsi was. These are the Macd, Rate or Change, Rsi and Dmi, thus providing a powerful multiple indicators based trade. Finally at Point D on the previous chart the limits of the day are reached with the 3rd Range Deviation combing with the 3rd Volatility Time Band for the optimum day trade exit point.