
You can place three types of lines (also referred to as cursors) on a chart: vertical, horizontal, and crosshair. The cursor value box values correspond to the selected vertical line. Global cursors allow you to link lines on separate charts.
•To add a vertical or horizontal line, click the time scale or the price scale to activate a line on the chart. Move the mouse to the desired line position, and click to park the line.
•To add crosshairs, activate both the horizontal and vertical lines, and then click to park them together.
•To move a line, click it to activate it. Before it’s parked, you can remove it by right-clicking.
•To remove a parked line, right-click either the line or the scale label, and then click Remove. To remove all lines at one time, right-click the scale label, and then click Remove All.
You can also use VertL and HorzL pointer tools.
To use global cursors
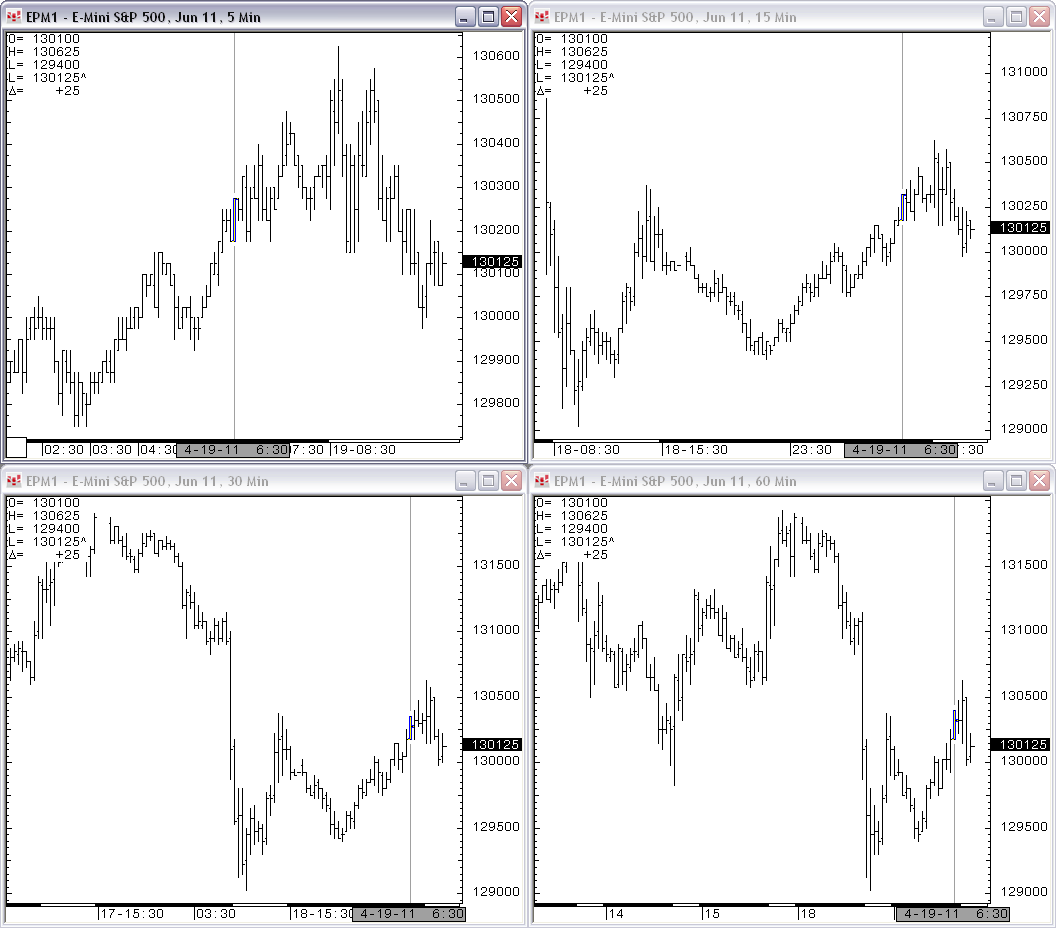
This option, typically used with charts of the same contract with different chart intervals, links the vertical cursors (lines) on two or more charts, so that moving the cursor on one chart, moves the cursor to the same time on the other chart(s). In this image, there are four EP charts at different intervals with a global cursor at 6:30.
1. With more than one chart open, right-click the time scale of a chart.
2. Click Global Cursors. The menu item is checked, and cursors are shown on the charts.
3. Notice that as you move the cursor on the first chart, the cursor on the linked chart(s) moves also.
4. To park all of the cursors, hold down the CTRL key and click.
To remove all of the cursors, hold down the CTRL key and right-click. Then, click Remove Linked Vertical Lines.
To change the appearance of lines
To change the color, thickness (weight), and type of line:
1. Right-click the vertical or horizontal line.
2. Click Modify.
You can also click Set Color to open color selection directly.
To change the cursor location on the scale:
1. Right-click the vertical or horizontal line.
2. Click Modify.
The Time field applies to the vertical line. The Value field applies to the horizontal line.
To show and hide the label on price scale:
1. Right-click the horizontal line.
2. Click Show/Hide Label on Scale.
You can also use the ScaleLabel parameter or right-click the label itself to open another menu.
To move or hide the Cursor Value Box
The Cursor Value Box is located in the lower-left corner of the chart window by default. The open, high, low, and close prices in that box correspond to the active vertical line (cursor) values.

•Click and drag the cursor value box to move it.
•To move the box back to its default location, right-click it, and select Move To Default Position.
You can choose to have the Cursor Value Box always displayed, displayed only with a vertical cursor, and never displayed (hidden). Right-click the box to display those options. When associated with a vertical cursor, the Cursor Value Box displays bar data.
To set Price X Line alerts
One way to use this alert is to set an email notification directly from the chart.
1. Add a horizontal line to the chart.
2. Right-click that line.
3. Click Add Price X Line Alert on Horizontal Line. The Price X Line Alerts window opens with the alert selected.
4. Make any desired changes to the alert.
5. Close the Price X Line Alerts window.