The Settings button turns on or off the display of the Plot and Other Params areas. With these settings hidden, the graph expands. When they are displayed, you can make changes that are immediately reflected in the graph.
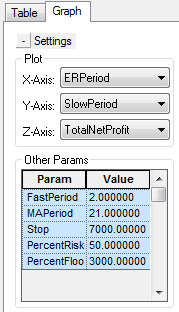
The Plot Area allows you to select values for the X-Axis, Y-Axis, and Z-Axis of the 3-D display.
1. Click the any of the drop-down list buttons to select the desired trade systems to be displayed on the X and Y axes and the desired TSO statistic to be displayed on the Z axis.
2. Click the Graph tab.
3. Click any Axis list to display the available values.
4. Click to select a value.
The graph updates immediately to display the selected value on the selected axis.
Note: Your axes settings won't change when you specify different TSO runs. However, they do revert to the default settings when you close TSO and reopen it.
The Other Parameters area allows you to adjust the values of other parameters that are not used as an axis, but are part of the Trade system upon which the current TSO run is based.
To change Other Params, click the parameter's value and select a value from the list. The 3-D graph adjusts to reflect the new parameter value.
To pause the optimizer
You can pause the TSO before it completes its run, then complete the run, or clear the values and start another run. To start another run, either using the current Optimizer settings, or new ones, the current results must first be cleared.
To pause the run
Click the Stop button on the Application toolbar. The Stop button becomes unavailable; the progress bar shows where the run was paused; and the results table is only partially filled.
To continue the run
Click Start. The run continues from the point at which it was paused.
To clear the results table
Once TSO has written results to the results table, a new TSO run cannot be started until the results table is cleared.
Click Clear. The results table is cleared, the step progress report is reset to 0, and the start button is available.
To copy the grid to the clipboard
TSO allows you to copy the table results data to the clipboard so you can paste it into another application, such as Microsoft Excel.
1. Click the Setup button.
2. Select Copy All Grid to Clipboard.
3. The grid data is copied to the clipboard.
To save results to a text file
The table results can be saved to a text file.
1. Click the Setup button.
2. Select Save Results to TXT File. The Save As window is displayed.
3. Enter the file name and location to which you want the text version of the results table saved. A text version of the results table and setup information is saved to the file.