Backtesting results can be displayed like any other study.
To display backtesting results for a Trade system
1. Click the Study button.
2. Click the Trade System tab.
3. Select the Trade system to be displayed.
4. Click the relevant Trade system button in the button column.
5. Click the Add button.
6. Click the Close button to close the Add Study window.
Elements of a backtesting display
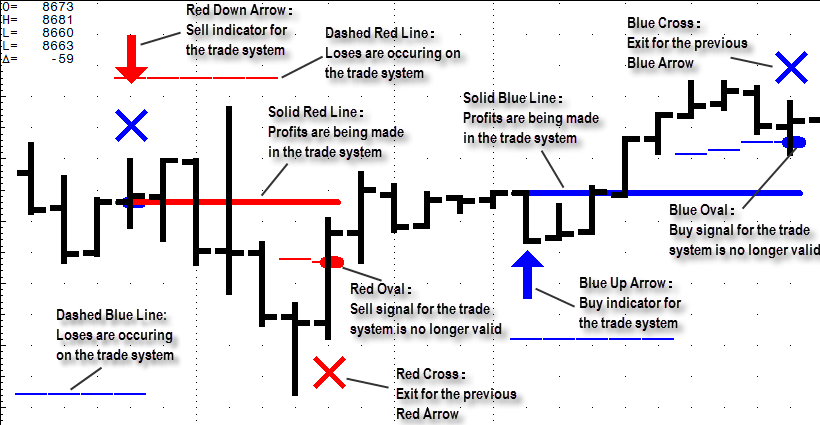
Backtesting displays consist of two windows. One window shows the up and down arrows, dashed and solid horizontal lines and ovals indicating the trades specified by the system. There is one set of these arrows, lines and ovals for each trade specified in the Trades for System section of Formula Builder for the relevant trade system.
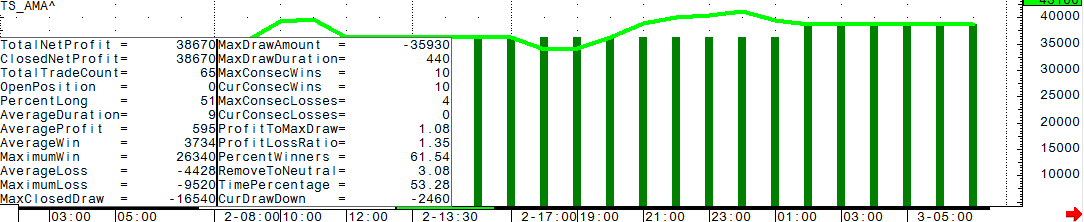
The second display window indicates the success of the system over the designated bar range, giving various indicators of risk and profit.
The following table describes the meaning of each of the elements in the top window of the Backtesting display:
|
Element |
Description |
|
Red & blue dashed lines |
Indicates losses are being incurred in the system. |
|
Red & blue solid lines |
Indicates profits are being made in the system. |
|
Red & blue ovals |
The end of the current buy or sell signal for the 2 systems. |
|
Red & blue up arrows |
Buy indicators for the 2 systems. |
|
Red & blue down arrows |
Sell indicators for the 2 systems. |