Candlestick Formations consist of 1-, 2-, or 3-bar patterns. These patterns compose the formations described in Steve Nison's Japanese Candlestick Charting Techniques (Prentice Hall, 2001).
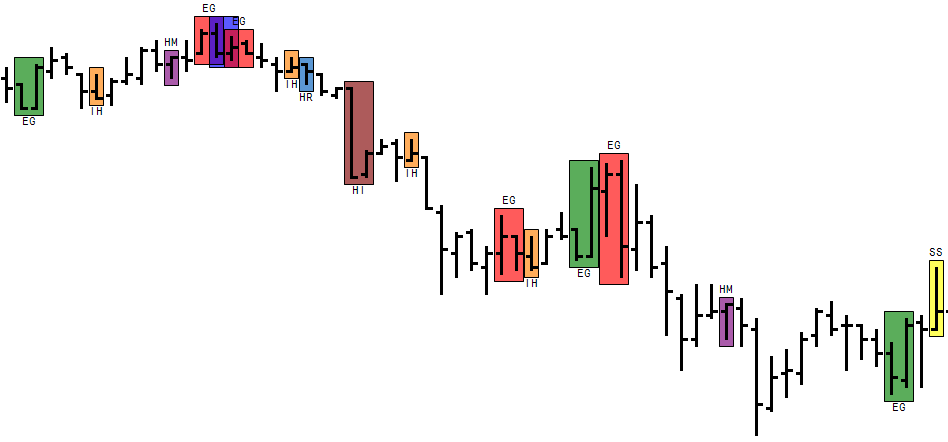
Text symbols appear either at the top or bottom of each formation (bearish at top, bullish at bottom). Double Doji appears at the top, and the question mark following it indicates it’s neither bearish nor bullish.
Candlestick formations appear as overlays on the chart in the colors selected in parameters.
|
1-bar formations: •Hammer (HR) •Hanging Man (HM) •Inverted Hammer (IH) •Shooting Star (SS) |
2-bar formations: •Engulfing Bearish (EG) •Engulfing Bullish (EG) •Dark Cloud (DC) •Double Doji (DD?) •Harami Bearish (HI) •Harami Bullish (HI) •Piercing Line (PL) |
3-bar formations: •Morning Star (MS) •Morning Doji Star (MDS) •Evening Star (ES) •Evening Doji Star (EDS)
|
Candlestick Formation Parameters
|
Parameter |
Description |
|
TxtColor |
Color for candle border and label. |
|
Formations |
Opens sub-window with parameters •Color: Candle fill color. When changing color and opacity, change the opacity before the color. •Trend: Number of bars considered in trend indicator. •Range: Average length of candlestick body as determined by number of previous bars. •Display: If selected, component is displayed. for set of candlestick formations. |
Candlestick Formations
Bearish formation and Double Doji symbols are at the top of the candlestick formation.
Bullish formation symbols are at the bottom of the candlestick formation.
|
Formation (symbol) |
Description |
|
Dark Cloud (DC) |
Bearish. Represents the opposite of Piercing Line. Established by two criteria: •The first real body of the formation is a "up." •The second real body's price opens above the prior session's high; however, by the end of the second session, the close has penetrated at least 1/2 way down into the prior session's "up" real body. Occurs after an up-trend or, at times, at the top of a congestion band. This, however, doesn’t affect the highlighting of the formation in any way. Does not require Trend or Range parameter. |
|
Double Doji (DD?) |
Neither bullish or bearish (as indicated by ?). Represents a condition in which the open and close for the first session are the same, followed by a second session in which the open and close are again the same. Does not require Trend or Range parameter. |
|
Engulfing Bearish (EG) |
Bearish. Represents the opposite of the Engulfing Bullish formation. Established by three criteria: •The market has to be in a clearly definable up-trend, even if the trend is short term. •Of the 2 candlesticks in the formation, the second candle's real body must engulf the first candle's real body. •The second real body of the formation should be "down" while the first real body should be "up." Requires Trend parameter. |
|
Engulfing Bullish (EG) |
Bullish. Represents the opposite of the Engulfing Bearish formation. Established by three criteria: •The market has to be in a clearly definable downtrend, even if the trend is short term. •Of the 2 candlesticks in the formation, the second candle's real body must engulf the first candle's real body. •The second real body of the formation should be "up" while the first real body should be "down." Requires Trend parameter. |
|
Evening Doji Star (EDS) |
Bearish 3-bar bottom reversal pattern. Represents the opposite of the Morning Doji Star formation. Established by three criteria: •The first real body of the formation is a strong (its real body length is larger than the average in the given range) "up.” •The second candlestick is a Doji (that is, open price is equal to close price) which gaps above the first real body. •The third candlestick MUST be a "down" real body whose closing price has penetrated at least 1/2 way down into the first candlestick's "up" real body. Requires Range parameter. |
|
Evening Star (ES) |
Bearish 3-bar top reversal pattern. Represents the opposite of the Morning Star formation. Established by three criteria: •The first real body of the formation is a strong (its real body length is larger than the average in the given range) "up." •The second candlestick has a small real body (at least twice as short as the first candle’s real body) which gaps above the first real body (may either be an "up" or "down" real body). •The third candlestick MUST be a "down" real body whose closing price has penetrated at least 1/2 way down into the first candlestick's "up" real body. An ideal Evening Star formation would have a gap before and after the second real body, however, a gap between the second and third bodies is rare (and not accounted for by the program). Requires Range parameter. |
|
Hammer (HR) |
Bullish. Represents the opposite of the Hanging Man formation. Established by four criteria: •The market has to be in a clearly definable down-trend, even if the trend is short term. •A real body that is at the upper end of the trading range (body color is not important). •A long lower shadow, which should be twice the height of the height of the real body. •A very short, if any, upper shadow, which should be at least twice as short as the real body. Requires Trend parameter. |
|
Hanging Man (HM) |
Bearish. Represents the opposite of the Hammer formation. Established by four criteria: •The market has to be in a clearly definable up-trend, even if the trend is short term. •A real body that is at the upper end of the trading range (body color is not important). •A long lower shadow should be twice the height of the height of the real body. •A very short, if any, upper shadow, which should be at least twice as short as the real body. Requires Trend parameter. |
|
Harami Bearish (HI) |
Bearish. Represents the opposite of the Harami Bullish formation. Established by four criteria: •The market has to be in a clearly definable up-trend, even if the trend is short term. •The first real body of the formation is longer than an average real body in given range. •Of the 2 candlesticks in the formation, the first candle's real body must engulf the second candle's SMALL real body (generally, the smaller the second body, the more potent the formation; the formation is highlighted if it is at least twice as short as the first one). •It is NOT a requirement that the real bodies of the candlesticks be opposite colored (that is, "up" vs. "down"). Requires Trend and Range parameters. |
|
Harami Bullish (HI) |
Bullish. Represents the opposite of the Harami Bearish formation. Established by four criteria: •The market has to be in a clearly definable downtrend, even if the trend is short term. •The first real body of the formation is longer than an average real body in the given range. •Of the 2 candlesticks in the formation, the first candle's real body must engulf the second candle's SMALL real body (generally, the smaller the second body, the more potent the formation; the formation is highlighted if it is at least twice as short as the first one). •It is NOT a requirement that the real bodies of the candlesticks be opposite colored ("up" vs. "down"). Requires Trend and Range parameters. |
|
Inverted Hammer (IH) |
Bullish. Represents the opposite of the Shooting Star formation. Established by four criteria: •The market has to be in a clearly definable down-trend, even if the trend is short term. •A real body that is at the lower end of the trading range (body color is not important). •A long upper shadow, which should be twice the height of the height of the real body. •A short, if any, lower shadow, which should be at least twice as short as the real body. An ideal Inverted Hammer formation is one that occurs after a downtrend or at the bottom of a congestion zone. Also, the larger the gap between the real body of the formation and the real body of the preceding bar, the stronger the confirmation. This, however, does not affect the highlighting of the formation in any way. Requires Trend parameter. |
|
Morning Doji Star (MDS) |
Bullish 3-bar bottom reversal pattern. Represents the opposite of the Evening Doji Star formation. Established by three criteria: •The first real body of the formation is a strong (its real body length is larger than the average in the given range) "down." •The second candlestick is a Doji (that is, open price is equal to close price) which gaps lower from the first real body. •The third candlestick MUST be an "up" real body whose closing price has penetrated at least 1/2 way up into the first candlestick's "down" real body. Requires Range parameter. |
|
Morning Star (MS) |
Bullish 3-bar bottom reversal pattern. Represents the opposite of the Evening Star formation. Established by three criteria: •The first real body of the formation is a strong (its real body’s length is larger than the average in the given range) "down." •The second candlestick has a small real body (at least twice as short as the first candle’s real body) which gaps lower from the first real body (may either be an "up" or "down" real body). •The third candlestick MUST be an "up" real body whose closing price has penetrated at least 1/2 way up into the first candlestick's "down" real body. An ideal Morning Star formation would have a gap before and after the second real body; however, a gap between the second and third bodies is rare (and not accounted for by the program). Requires Range parameter. |
|
Piercing Line (PL) |
Bullish. Represents the opposite of the Dark Cloud formation. Established by two criteria: •The first real body of the formation is a "down." •The second real body's price opens below the prior session's low; however, by the end of the second session, the closing price has penetrated at least 1/2 way up into the prior session's "down" real body. The formation occurs after a downtrend or, at times, at the bottom of a congestion band; however, it doesn’t affect the highlighting of the formation. Does not require Trend or Range parameter. |
|
Shooting Star (SS) |
Bearish. Represents the opposite of the Inverted Hammer formation. Established by four criteria: •The market has to be in a clearly definable up-trend, even if the trend is short term. •A real body that is at the lower end of the trading range (body color is not important). •A long upper shadow should be twice the height of the height of the real body. •A very short, if any, lower shadow, which should be at least twice as short as the real body. An ideal Shooting Star formation is one that occurs after an up-trend or at the top of a congestion zone. Also, the larger the gap between the real body of the formation and the real body of the preceding bar, the stronger the confirmation. This, however, does not affect the highlighting of the formation in any way. Requires Trend parameter. |