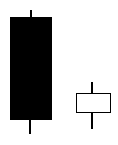
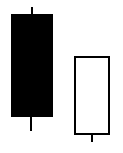
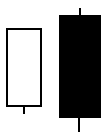
Bullish Engulfing

Bearish Engulfing
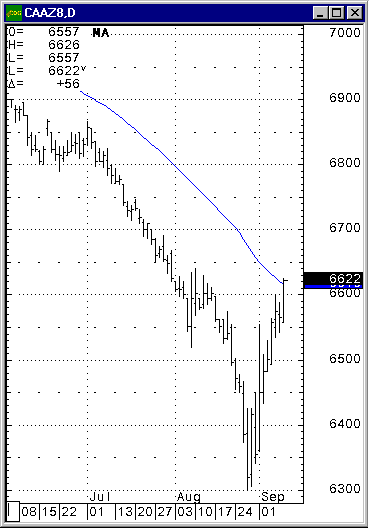
This set of indicators identifies the 5 pairs of candlestick patterns, which Kase finds the most useful and screens them for significance.
They can be used to identify the danger of a possible turn and also, with the exception of the Hammer and Hanging Man, to accelerate exits, especially on the daily chart, or a chart one time frame higher than you are trading, substituting the candle exit for Dev 1.
Evening and Morning Stars, since they are three candle patterns, generate a warning and setup after two candles are completed. We then know that all we need is a third candle to complete the pattern. In a two-candlestick pattern, we do not know whether the pattern is complete until the second candlestick is in place.
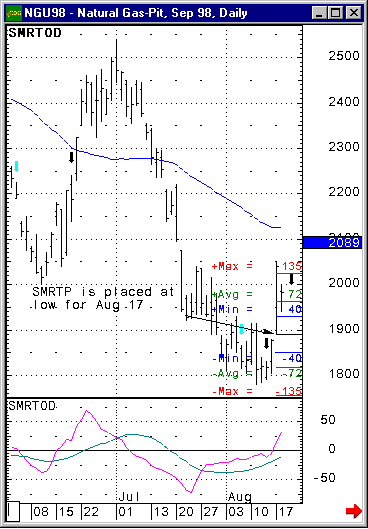
Given that reversals generally take place at the “top” or “bottom” of trends, in order to filter out less meaningful patterns, we screen our candle patterns with the Stochastic, only identifying the patterns under “overbought” (bearish) or “oversold” bullish (conditions).
These patterns are especially significant when accompanied by divergence and PeakOut signals.
A cross on the high of the candle identifies Bearish candle patterns and a cross on the low indicates a bullish candle pattern. All candles contain the same inputs.
Candlestick Indicators Parameters
•Color: Color of the text on the study.
•Threshold: The extremes for the slow stochastic pattern filter. For example, a default of 75 means that bearish formations will only be identified when the stochastic is above 75 and bullish formation s below 25. Likewise, a threshold of 90 would identify candlestick patterns only if the stochastic is above 90 or below 10.
•Display
Engulfing Patterns
The bullish and bearish engulfing lines are reversal patterns, which entirely “engulf” the previous bar as shown above.
If this pattern is coincident with an extreme PeakOscillator reading and or divergence, wait to see if that pattern is completed. If there is a gap higher on the next bar in a bull market or lower in a bear market, substitute the Harami line mid-point for DevStop 1.
|
Bullish Engulfing
|
Bearish Engulfing
|
Evening & Morning Star Patterns
This 3-candle reversal pattern includes a large range day with the trend, an exhaustion gap, stall day, breakaway gap, and a large range reversal candle.
After the formation of the first two candles, pull in your DevStop1 to the mid-point of the 1st candlestick.
For example, on day 3 of the patterns, exit the portion of the trade that would have normally been exited on the DevStop1 at the mid-point of the blank Harami line (first bar of the pattern).
|
Morning Star Bullish
|
Evening Star Bearish
|
Hammer & Hanging Man Patterns
These patterns, while identical, occur at the bottom of the market for the bullish Hammer, and at the top of the market for the bearish Hanging Man.
While not as significant as other patterns on its own, it adds weight to other patterns, for example, as the star in a Harami Line and Star. Also, it acts well as a warning, taking place often a few bars before an actual reversal.
|
Hammer Bullish
|
Hanging Man Bearish
|
Harami Line Patterns
In the case of the Harami Line & Star pattern, look for closes against the open of the Harami Line. In the case of a bearish pattern at the top of a bull market, watch for a close of the candlestick following the star that is below the opening of a blank Harami line. The opposite holds true in a bear market. This level is substituted for DevStop 1.
|
Harami Line & Star,
|
Harami Line & Star,
|
Piercing Patterns
If this pattern is coincident with an extreme KCD or PeakOscillator reading and/or divergence, we wait to see if that pattern is completed. If there is a gap higher on the next bar, in the case of a bull market, or a gap lower in the case of a bear market, substitute the mid-point of the Harami line for DevStop 1.
|
Piercing Pattern
|
Dark Cloud Cover
|