Shortcut
Action

Moves active cursor in correspondent direction, and adds a new cursor if one is not present.
Corresponds to the scroll buttons.
\study
Adds a study to the chart. Replace “study” with an actual study.
Enter \ followed by the study abbreviation, e.g. \RSI.
Ctrl
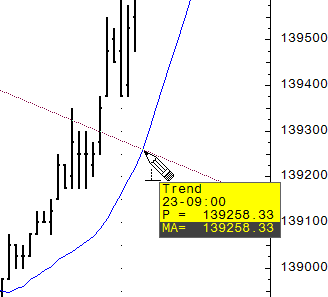
Draws trend and trend channel lines perpendicular to another tool or study. (Trend and trend channel lines can “snap” to other tools and studies.)
For example, this image shows a perpendicular trend line snapping to a moving average curve. Notice the change in the cursor:

Compresses the price scale.

Compresses the time scale.
Ctrl + Alt +G
Opens the Specify Conditions window (on base curve).
Ctrl + Alt +M
Opens the Modify All Study Parameters window.
Ctrl + Alt +Shift+D
Opens the Remove a Study window.
Ctrl +Alt+D
Opens the Add a Study window.
Delete
Removes cursors (horizontal and vertical lines).
Double-click chart
Autoscales the chart according to the current autoscale selection (with or without studies) and centers price scale. Equivalent of ENTER in the entry field.
End
Moves to the current bar.
Enter
Used to rescale the chart.
Restores both the Value/Price Scale and the Time Scale to the default spacing and to activate the AutoScale feature. Once the AutoScale feature is activated, the charts automatically scale themselves until a manual scaling command is entered.
Esc
Used with pointer tools.
If Esc is pressed after a tool has been drawn, the pointer tool selection to is changed to None.
If Esc is pressed while a tool is being used, the tool drawing is removed from the chart, but the cursor remains an active pointer tool. For example, suppose you are adding speed lines to a chart. Click once to start drawing the lines, but you decide to start the drawing elsewhere. Press Esc, so that the first line is removed from the chart, but the pointer tool is still active (as evidenced by the cursor).
If you press Esc during an adjustment of a tool drawing, the drawing returns to its previous state.
F10
Hides the Daily Value Box, Cursor Value Box, SnapTrader or SnapTrader 2, and Order Book, if displayed. Press F10 a second time to show the tools again.
F11
When Trade Value Box is displayed, shows/hides Account Picker.
Home
Used to rescale the chart.
Restores only the vertical, value/price scale to the default spacing.
Page Up
Page Down
Scrolls to the top and bottom of visible curves.
Shift
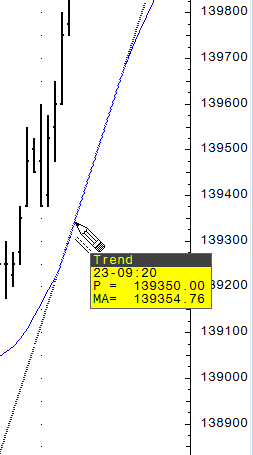
Draws trend and trend channel lines parallel to another tool or study. (Trend and trend channel lines can “snap” to other tools and studies.)
For example, this image shows a parallel trend line snapping to a moving average curve. Notice the change in the cursor:

Expands the price scale.

Expands the time scale.