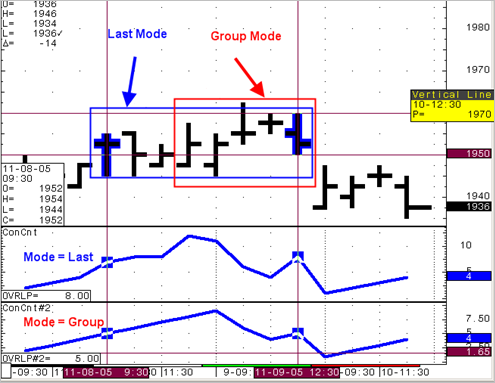

This study helps the trader identify areas of congestions by either two methods – Last or Group. Last refers to the last bar sharing price range values with previous bars and group refers to every bar in the group sharing price range values. When the price range values are no longer shared with previous bars or grouped bars the counter is reset to one.
Use it during periods of tight trading ranges usually associated with low trade volume. The function will alert a trader of long periods of congestion with the possibility of a “break-out” in price and away from congestion.
Any market that is consolidating in close overlapping price ranges is a good market for this study.
The counter will reset itself to one when price values are no longer shared with previous bars or grouped bars. It will then increment when sharing takes place.
In the chart shown above, the blue rectangle shows all the bars that are included in the overlap count for Last. The 7 bars to the left of the selected bar overlap it. (The selected bar is included in the count.) The next bar to the left and outside the blue rectangle does not overlap with the selected bar, so it is not counted. The red rectangle only shows five bars in a group. Group mode requires each bar in a group to overlap all other bars in the group. Every bar must have at least one value in common with every other bar in the group. The rectangles do not appear on your chart. They have been added to make it easier to explain how this study works.
Congestion Count Parameters
|
Parameter |
Description |
|
Display |
Opens sub-window to set parameters •Color = Line color. •Weight = Line thickness. •Display = Line style: line or histogram. •ShareScale = Determines whether sharing of the vertical scales between studies is accepted. Auto = System determine whether sharing is feasible. On = Scale is shared regardless of the functions and studies displayed. Off = Scale is not shared. ShareScale must be On if study is overlaid on a study with multiple outputs. |
|
MarkIt |
Opens Specify Conditions window. |
|
Type |
High and low type. Values: •Chart = use high and low outputs from the bars •True = use true lows and true highs |
|
LookBack |
Number of bars the study should compare to the current bar. Establishes the maximum value for the study. |
|
Mode |
Boundaries of congestion count. •last = counts back from the selected bar to the last bar that has values overlapping the selected bar. •group = counts back from the selected bar to the last bar that does not have overlapping values with all bars between it and the selected bar. |