What it does
Measures the dollar gain or loss between two points on a chart. This tool is especially helpful for measuring results when backtesting.

How to use it
1. Right-click the chart, point to Pointer Tools, then click Currency. The cursor is displayed as a pencil.
2. Click the chart to indicate your entry point, the starting price.
3. Drag the mouse to the desired price for the end point, and click.
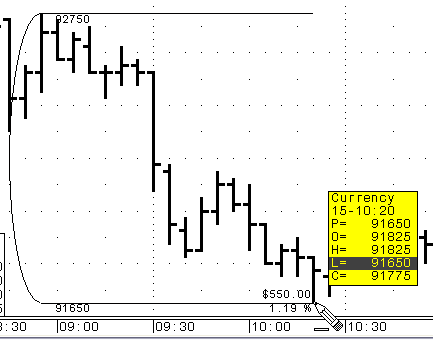
The display indicates the current point value (91650) at the cursor location as well as the dollar gain or loss ($550.00, 1.19%) per contract based on the starting price.
The dollar change is displayed only if the currency pointer tool is expanded enough to accommodate it.
Like several other pointer tools – Profile Area, Ellipse, and Rectangle – Currency can be modified.
1. Click the currency arc, so that red squares appear at both the start and end points.
2. Click the red square to activate the pointer tool.
3. Drag the mouse to the new position, and click.
Currency Value parameters
$1:1 = entry point of first instance of currency pointer tool
$1:2 = exit point of first instance of currency pointer tool
$2, $3, $4, etc. = other instances of the currency pointer tool on this chart
|
Parameter |
Description |
|
Display $1:1 |
Opens sub-window with display parameters. Color = Select colors for lines. Weight = Select thickness of lines. |
|
Display $1:2 |
Opens a sub-menu of label parameters: Position = Select location of label. Id Wt = Select thickness of label. ScaleLabel = When selected, the display highlights the initial set point on the time axis. |
|
Value |
Select the prices for the start and end points. You can use a specific price or open, high, low, and close. |