1. Click the Display button to reveal the Setup Options Graph Contents window or right-click the title bar of the Options Graph window.
2. Select Customize displays.
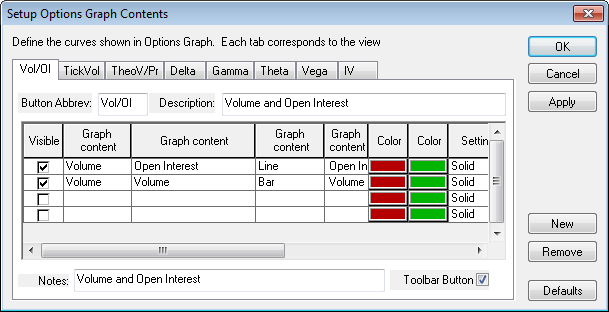
The Setup Options Graph Contents window gives you wide latitude to customize Options Graphs displays. By default, the window displays 8 tabs: Vol/OI, TickVol, TheoV/Pr, Delta, Gamma, Theta, Vega, IV. Within each tab you can select a Button Abbreviation, Button Description, Graph Content, Put and Call Colors, Specific Graph Style Settings, Smoothing properties, and the Multiplier.
You may also add, remove or change the construction of any of the display tabs or revert the display back to its original state, that is, its state before any changes were made.
Click the New button to place a new tab in the Setup Options Graph Contents window and clear the cells so you can make new selections.
If you enter a name in the Abbreviation section, this name appears as the toolbar button name and as the tab name in the Setup Options Graph Contents window.
The name entered in the Description box appears in the title bar of the Options Graph window when that graph is displayed.
Within the Graph Content section of the window you can select the Scale, Data type and Display type and enter a Caption.
The Scale variable allows you to select the value displayed on the vertical axis.
1. Click the drop-down list arrow to display the choices.
2. Select one or more of the choices, which include: Price, Greek and Volume.
Note: You can select a Multiplier to adjust scales that have different magnitudes.
Depending on the Scale choice, you have different Data choices available. The Data choices for each Scale choice within each tab include:
Data choices for the Price scale:
•Price-Theor.Value
•Theoretical Value
•Price
•Close Price
•Last Price
•Open Price
•Strike Price
•Yesterday's close
•Settlement
•Ask
•Bid
•Trade or Settlement
Data choices for the Greek scale:
•Delta
•Gamma
•Theta
•Vega
•Rho
•Implied Volatility
Data choices for the Volume scale:
•Volume
•Open Interest
•Tick Volume
Select from the following display types:
•Unsmoothed line
•Bar
•Smoothed line
Input a brief description in the Caption section. The caption appears in the mouse text that is displayed when you move the mouse over a display element.
You can select the call and put colors for each of the lines within each tab.
1. Click the color under the Call or Put heading.
2. Select a color from the color palette.
In the settings sections, users can select a Style, Hatch, and a Width size.
The Style section allows users to further refine the Display choice.
Style choices include: Hatch and Solid.
Note:
Hatch style refers to a pattern within the bar.
Selecting a hatch
style facilitates differentiating bar colors when printing on a black and white
printer.
A Hatch style can only be selected if you have chosen
Bar as the Display type.
If you have selected Hatch as the designated style, you can select a hatch style from the drop-down list under the Hatch heading.
If you have chosen Solid as the designated style, you can set the thickness of the line (not the thickness of the bar) in pixels in the Width area of the Settings section.
Choosing the smoothing characteristics allows you to decide how the curve is fitted to the actual display points. You can only choose smoothing characteristics if the Smooth display type has been chosen.
CQG allows you to select from the following smoothing methods:
•Standard: If you select the Standard method, you can select a polynomial degree and a sensitivity. The higher the polynomial degree, the more flexible (curvy) the line is and therefore, the better it fits the curve. However, the more points that are considered, the less generally applicable the curve will be. The higher the sensitivity number, the more points are taken into consideration when fitting the curve.
•Polynomial: The Polynomial method uses the following
formula:
Y(X) = a0 + a1*X + a2*X^2+aR*X^R
Where the a's are values
automatically selected by CQG to make the curve
fit.
•Hyperbolic: The Hyperbolic method uses the following
formula:
Y(X) = a0 + a1/X + a2/X^2+aR/X^R
Generally works the same way as
the Polynomial method, with the X's representing observed values and the a's
representing coefficients which make the curve fit. However, this method would
present a more accurate curve if the shape of the points was more like a
hyperbola rather than a parabola, i.e. the curve does not switch directions.
Note: Users may want to try all three methods to see which yields the best fit for the observed points.
You must choose Smooth as the Display type for the smoothing variables to become active.
Selecting a multiplier increases the values on the vertical scale by the selected factor. Enter the desired factor in the Multiplier section.
You can enter a note that appears whenever the Setup Options Graph Contents window is visible.
Select the Visible checkbox next to the desired display element to include that graph element in the display.
Clear the checkbox next to the desired display to eliminate that piece from the display.
Click the Remove button in the Setup Options Graph Contents window to remove the entire tab and all the curves associated with that tab.
The Setup Options Graph Contents window enables you to add, remove and rename the tabs. Additionally, you can easily restore the window to its original settings.
To add a tab to the display:
1. Click the New button
2. This displays a new template with the Abbreviation and Description sections blank.
3. Enter an Abbreviation and Description for the new tab.
4. The abbreviated name actually appears on the tab.
5. The description appears in the title bar.
6. Select the Scale, Data and Display characteristics from the respective drop-down lists.
7. Enter a caption, if you want one.
8. The inputted caption appears as part of the mouse text.
9. Select the desired Colors, Settings, Smoothing and Multiplier characteristics.
To remove a tab from the display:
1. Select the desired tab.
2. Click the Remove button.
3. You cannot remove all the tabs; at least one must be displayed.
To rename a tab:
1. Click in the Abbreviation box.
2. Enter the new name.
3. To restore the defaults:
4. Click the Defaults button to restore the system to its original state (when first delivered to the user).
You can revert Options Graph displays to their original state (the state when CQG was first delivered) by:
Clicking on the Defaults button in any of the tabs in the Setup Options Graph Contents window.
This restores ALL the tabs to their original state.