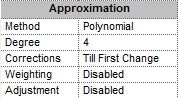
In the Approximation section, you select characteristics used for estimating the curve. Specifically, select the approximation method used to fit the data points, the degree of the polynomial, used by the curve to fit the points, the corrections method, the weighting scheme and the adjustment method.
Volatility Workshop offers 4 approximation methods. Large n values pose 2 problems:
•Data spikes take on greater importance
•The behavior of the curve for data points outside the range is exaggerated.
|
Method |
Formula |
|
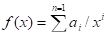
Polynomial
|
Where n is the degree parameter and is user-defined. The coefficients are selected to guarantee the least possible error between data points and curve points according to their weights (i.e. the greater the weight given to the point, the closer the curve should be to that point). Larger n values result in lower errors. |
|
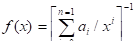
Hyperbolic
|
Where n is the degree parameter and is user-defined. The coefficients are selected to guarantee the least possible error between data points and curve points according to their weights (i.e. the greater the weight given to the point, the closer the curve should be to that point). Larger n values result in lower errors. |
|
Reciprocal
|
Where n is the degree parameter and is user-defined. The coefficients are selected to guarantee the least possible error between data points and curve points according to their weights (i.e. the greater the weight given to the point, the closer the curve should be to that point). Larger n values result in lower errors. |
|
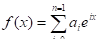
Exponential
|
Where n is the degree parameter and is user-defined. The coefficients are selected to guarantee the least possible error between data points and curve points according to their weights (i.e. the greater the weight given to the point, the closer the curve should be to that point). Larger n values result in lower errors. |
Changing the curve degrees changes the flexibility of the curve, enabling it to better fit the points. However, increasing the number of degrees also causes the curve to behave erratically at the endpoints.
|
Corrections |
Description |
|
Disabled |
No corrections are made. |
|
Till First Change |
When the system calculates a new implied volatility, the user-selected IV is discarded. |
|
Absolute Value |
The corrected value is maintained even when new ticks are received. |
|
Absolute Difference |
The implied volatility value changes but the difference between the actual implied volatility and the setup implied volatility remains the same. Example: If the real implied volatility was 50 and the setup implied volatility was 52, and, subsequently, the real volatility increased to 54, the setup implied volatility would rise to 56. |
|
Relative Difference |
The implied volatility value changes but the percentage difference between the actual implied volatility and the setup implied volatility remains the same. Example: If the real implied volatility was 50 and the setup implied volatility was 10% more, i.e. 55, and, subsequently, the real volatility increased to 60, the setup implied volatility would rise to 60 + 10% or 66. |
Selecting a weighting factor allows you to designate how various volatilities is used to create the volatility curve. Volatility Workshop offers 3 distinct weighting factors. Additionally, you can create customized weighting factors or use no weighting (by selecting disabled). The 3 weighting factors offered are:
•Volume (yesterday's)
•Open Interest (yesterday's)
•Tick Volume (today's)
To create a customized weighting scheme:
1. Select Customized from the weighting drop-down list in the Approximation section.
2. Enter the desired weights in the Weights row of the Volatility Workshop table.
Note: You can only enter new weight values directly when the Customize option has been selected. However, by excluding selected series (by clearing the box in the Included row), you can create a form of weighting.
CQG offers two adjustment methods for calculating the volatility curve, Underlying and Bourtov.
•Underlying Adjustment Method: For the Underlying Adjustment method, implied volatility values are moved horizontally a distance equal to the difference between the current underlying price and the coherent (at the moment of the tick) underlying price.
Example: Assume the implied volatility is 25.35 and the last tick happened when the underlying was 1115.70. Currently, the underlying stands at 1117.10. Without any adjustment the point 1000, 25.35 is used to draw the volatility curve. With the adjustment, the point is 10001.40, 25.35, where 1001.40 = 1000 + ( 1117.10 – 1115.70)
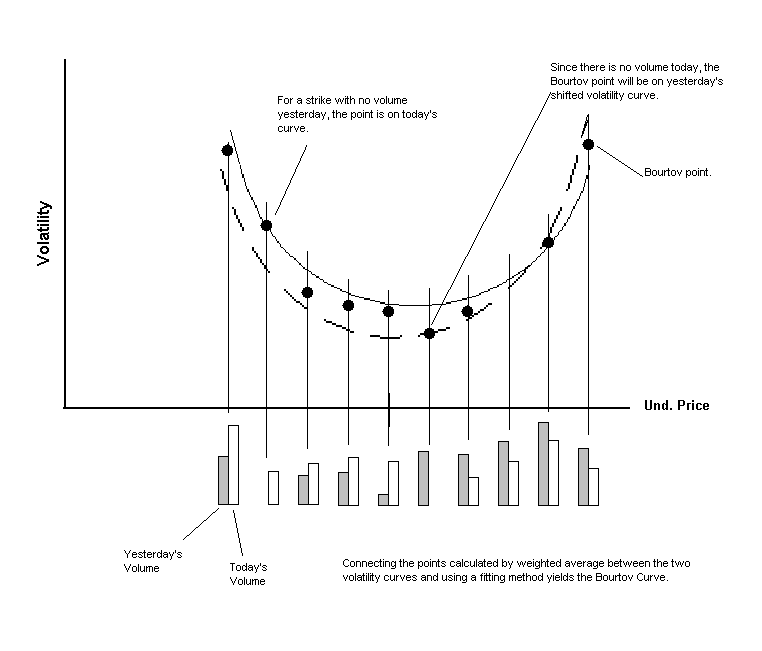
•Bourtov Adjustment Method: The Bourtov Adjustment Method involves 3 steps:
•Taking yesterday's volatility curve.
•Shifting it (while keeping the shape the same) according to the change in underlying price.
•Adjusting the shape according to the relative volumes (either tick or actual, depending on which was selected from the drop-down list related to Weighting) of the strikes between yesterday and today.
Steps 1 & 2
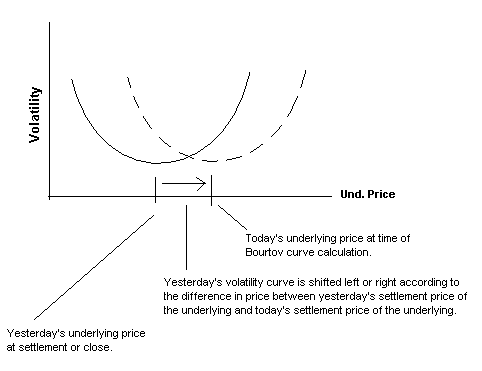
Step 3