The CQG 3D TSO graph gives users a clear picture of the interaction of three variables that were used in the TSO run.
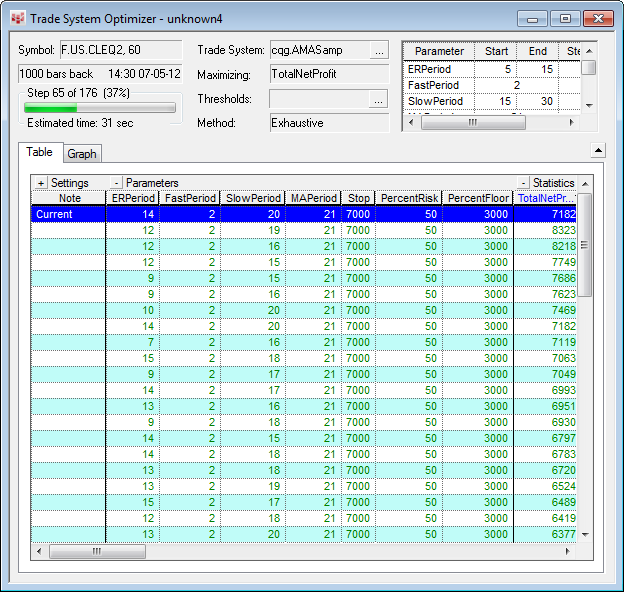
1. Run the TSO.
2. Click the Graph tab.
3. Set up the XY-Axis with the parameter you put a range on, and set up the Z-Axis with the profit parameter you would like to maximize or minimize.
From the 3D Control Properties window you can set the display and motion characteristics related to the 3D TSO graph display. The values plotted in each axis are displayed in the Plot area. If the trade system uses other parameters, they are displayed in the Other Params area, where you can adjust their values and immediately view the changes to the graph.
To access the 3D Control Properties window
1. Right-click in a 3D TSO window.
2. Select Properties.