To export the evaluation results to Excel, click the button in Results View Parameters:
Excel is opened automatically. (Must be Excel 2007 or later).
The workbook contains 5 or 6 sheets, depending on whether you are in commodity or portfolio mode.
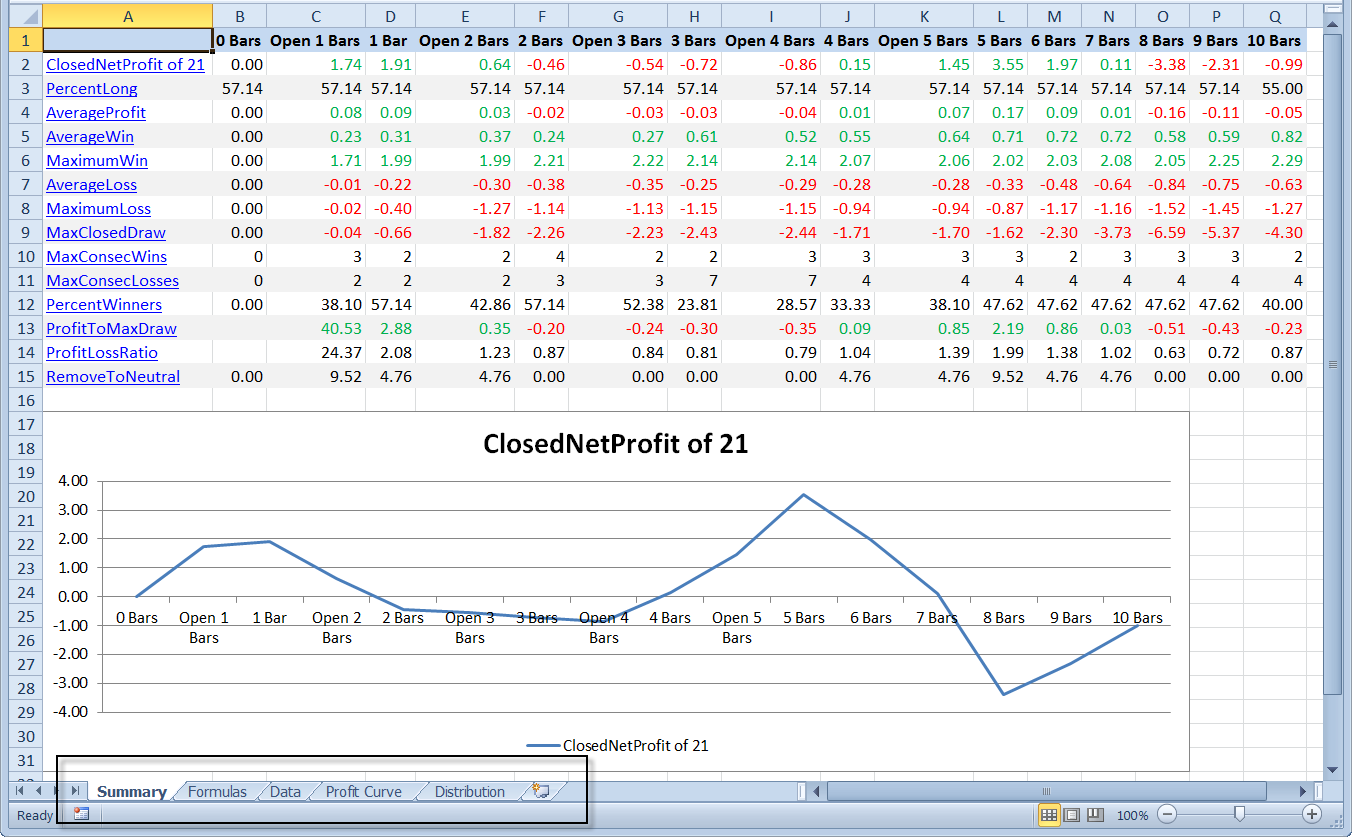
Summary
Shows summary table and summary chart. The summary chart displays the value of the first row in the worksheet. Click the values in column A to change the chart.
Formulas
Shows parameters: Start Date, End Date, Value Display, Bar Interval, Showing, Portfolio/Commodity, Sell Signal, Sell Entry Price, Buy Signal, Buy Entry Price.
Data
Shows columns: Commodity, Date, Entry, and bars. Rows of short entries are have an orange background. Positive bars out values are green, negative are red, and neutral are black.
Profit Curve
Shows pivot table and pivot chart for the table in the Data worksheet.
Distribution
Shows table of distribution data calculated dynamically depending on selected bars out in Distribution worksheet.
Portfolio
Shows pivot table and pivot chart for the table in the Data worksheet.