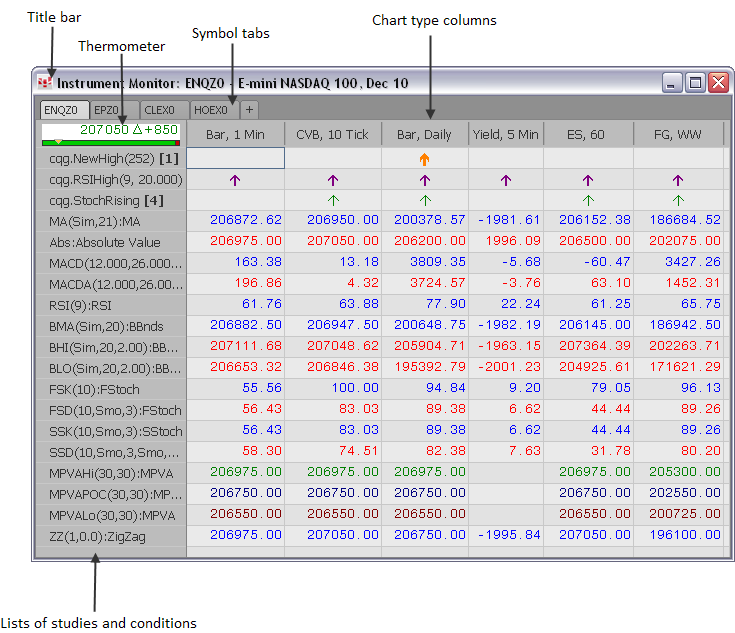
Instrument Monitor list conditions and studies in the left panel and plots chart values in columns.
Title bar
Instrument Monitor title bar includes contract information. Instrument Monitor is abbreviated as IMon when the window is narrow.
Right-click the title bar to:
•Rename the window.
•Show or hide tabs.
•Size the window to fit the columns and rows.
Thermometer
The thermometer, similar to the thermometer on the DOMTrader tabs, indicates the current market standing of the symbol relative to its opening, high, and low prices. It shows the High to Last (Red), Low to Last (green), and Open (yellow triangle) for the current day. The close or last price is indicated by the change of color from red to green. If the thermometer displays all yellow, then data is not available. The last price and net change are displayed above the thermometer.
Study and condition list
The left panel of the monitor lists the studies and conditions that are being calculated for the different chart types. It includes the current parameter settings for each study. The numbers in brackets indicate how many of the chart types meet this condition. The tooltip lists the types.
Chart types
The right panel of the monitor displays a column for each chart type. The chart interval is included in the column heading.
The colors are determined by study and condition parameters. In this image, orange arrows, yellow circles, and green arrows indicate that particular conditions have been met.
The red triangle in the corner of some cells indicates that the parameters of this cell differ from the parameters of the study on the chart, i.e. they have been changed on the monitor. Empty study cells indicate that data is being updated.