Volatility Workshop allows you to modify the shape and position of the main volatility curve. You can make up to 7 modifications to the volatility curve. Within the 5 modification areas, CQG offers 2 ways to modify each aspect of the volatility curve, either by dragging the curve and adjusting it directly in the window, or by entering numbers in the Modifications table. The 5 types of modifications are: Horizontal Shift, Vertical Shift, Horizontal Shape, Vertical Shape and Slope.
In addition, you can set the minimum and maximum percent volatilities specifications from the Modification table.
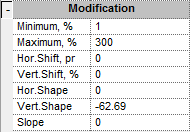
Selecting the Minimum and Maximum Percent Modifications
The maximum percent implied volatility represents the smallest implied volatility that is displayed on the graph. Volatilities smaller than the designated value are displayed as horizontal lines at the minimum value.
The minimum percent implied volatility represents the largest implied volatility that is displayed on the graph. Volatilities greater than the designated value are displayed as horizontal lines at the maximum value.