Yield charts require fixed income price symbols. The Yield Curve chart cannot plot a yield from a yield symbol.
Forward curves can plot yield symbols or price symbols. For example, LIBOR rates can be plotted in the Forward Curve chart, but not the Yield Curve chart.
1. Right-click the chart title bar.
2. Click Open Forward Curve or Open Yield Curve.
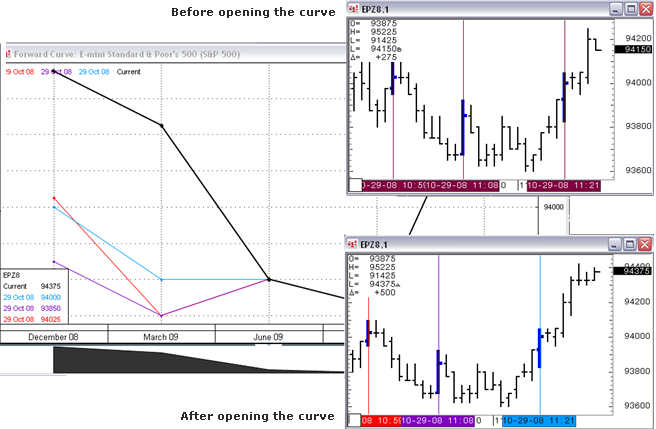
If there are vertical lines or vertical cursors on the chart, the corresponding curves will be shown in the curve window. Those curves are linked to the lines and cursors on the chart.
If the chart does not have vertical lines or vertical cursors, then a Curve Module tooltip is displayed on the chart when you open the forward or yield curve.

Vertical lines and vertical cursors will change color when a curve is opened and stay that way even when the curve is closed.
