Season is a study that is an overlay study on a daily continuation bar chart.
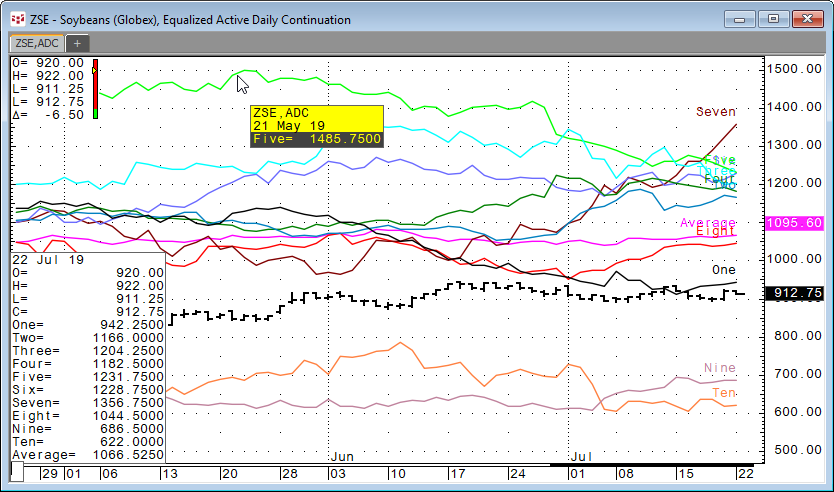
When added to the daily continuation bar chart the Season study will pull in the previous ten individual years of bar data. You can use daily continuation or active daily continuation.
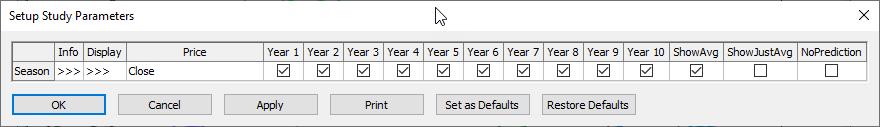
The preferences allows you to select which years you want displayed. You can select using a market data parameter other than close, such as HLC/3. You can choose to display an average of the years selected, or just the average. If the NoPrediction parameter is unchecked you can drag the chart to left and see how the previous years’ data moved looking forward.
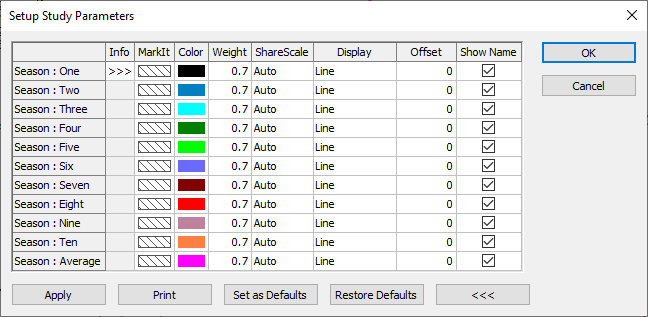
Select display preferences to choose colors of the lines, set ShareScale to Auto or On, select a line style and to show names.
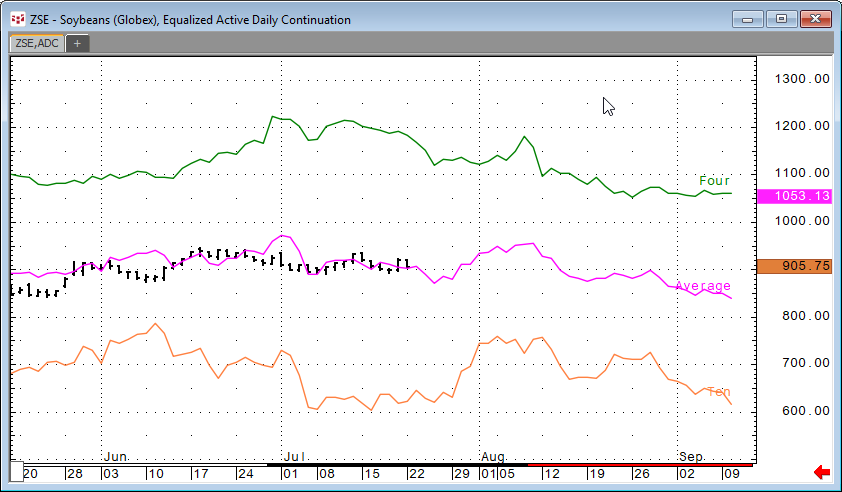
Here, the four-year, ten-year, and the average of the two are displayed. The chart was dragged to the left to display how the historical data unfolded for the next two months.