Histogram parameters allow you to add horizontal bars, representing normalized values, to a column. A histogram provides a graphical representation of data that is more readily accessible than numerical values.
In the Price column, a new high and new low are indicated by a second bar, outlined in black.
|
Parameter |
Description |
|
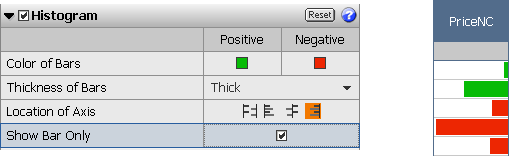
Color of Bars |
Select colors for both positive and negative values. Default: Positive = green. Negative = red. |
|
Thickness of Bars |
Select the width of the bars. Values: Thin, Medium, Thick. Default = Medium. |
|
Location of Axis |
Choose the alignment of positive and negative values in the cell. Values: Positive Left/Negative Right, Left, Center, and Right. Default = Positive Left/Negative Right. |
|
Show Bar Only |
Select this check box to hide the cell value and display only the histogram bars. Default = off. |