After all the settings and selections are made in the TSO Setup window and that window is closed, you are once again looking at the TSO Main view. Nothing is displayed in the table area until the optimizer is run.
The upper section of the window displays summary information about the settings and selections upon which the current run is based. This section can be contracted so the parameter settings and some TSO summary fields are not displayed, leaving more room to display result rows.
Expanding or Contracting the Summary Section
1. Click the Up arrow button to contract the window. The Up arrow becomes a down arrow.
2. Click the Down arrow button to expand the sections so the summary fields and parameters show. The Down arrow becomes an up arrow.
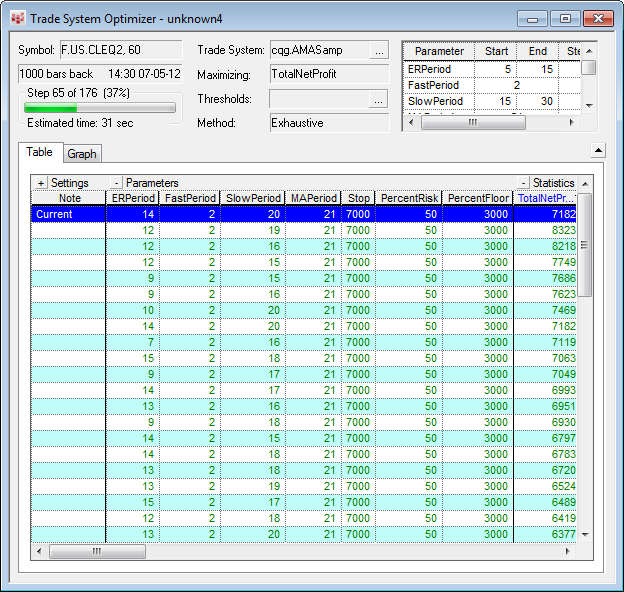
After the optimizer is run, the lower section of the window displays the detailed information about each step (parameter value) that makes up the run.
The results table shows information about the parameter values used and the summary results for the trade system.
If the Table settings are not displayed when you first open the window, click the plus sign next to Settings above the heading row of the table. The Settings information expands and is displayed to the left of the table. To collapse the settings so you can see more columns of data in the table, click the minus sign next to Settings.
Table settings determine the order in which results is displayed, the number of results, and how and when the associated chart is displayed.
Displaying the Settings
Selecting the box next the word Settings displays the parameters whose results are shown in the table.
The results in the table can be sorted by any of the parameters or statistics that are shown in the table. The default Sort By value is the Optimize On parameter.
To select the column to sort by:
1. Click the Sort By arrow and select the parameter or statistic to sort by.
2. Select Descending or Ascending or click the column heading to sort by that column.
3. Click again on the column heading to change the sort order.
The column heading for the current Sort By column is displayed in a different color, and the stack of lines next to the column name indicates whether it is descending (the lines get smaller from top to bottom) or ascending (the lines get larger from top to bottom).
Setting Max Best Results
This setting limits the number of rows to include in the results table. If this number is set to a number lower than the total number of steps, only the best results is displayed. This value must be an integer in the range of 1-2000. The default setting is 100.
Display Chart With
These settings determine whether the chart display is updated, and if it does, what values is used for the update. Choices include:
|
Options |
Description |
|
Current Value |
After x steps have been completed, displays the chart with the value for that row. |
|
Best Value |
After x steps, updates the chart with the best value (if it changed). |
|
Best for Refresh |
Displays the best value within x steps, and is updated after x steps. |
|
No Update |
The chart associated with this TSO run is not updated while TSO is running. |
Setting After Steps
The after steps setting determines how often the chart is displayed or updated with the results table data. If No Update was selected in the Display Chart with box, you won't be able to set the after steps. This value must be an integer in the range of 1 to 100. The default setting is 5.
Customizing Columns in the Table
Users can customize the columns in the TSO window.
1. Right-click the tab title.
2. Select Customize Columns.
By default, all parameters and statistics used in the Trade System are displayed as columns in the results table. However, you can select the parameters you want to see, and what order they'll be displayed in.
Even if you customize the columns, you can still display all the parameters or statistics quickly by clicking on the square buttons to the left of "Parameters" or "Statistics."
The square buttons next to Parameters and Statistics in the line above the column headings reflect whether the columns have been customized.
|
Button Label |
Description |
|
Minus sign (-) |
All Parameters or Statistics are displayed, but custom columns have been selected. Click to display custom columns only. |
|
Plus sign (+) |
Custom columns are displayed. To display all columns, click the button. |
To select columns to include in the results table
1. Click the Setup button or right-click Parameters or Statistics in the line above the column headings.
2. Select Customize Columns.
3. Select the Parameters tab or the Statistics tab. Both tabs work the same way, but these instructions refer to Parameters, since that is the first tab and is the one shown above.
4. Click the >> and << buttons to move parameters between the Shown and Not Shown columns. The default setting is to display all parameters and statistics.
5. Select a parameter and click the Move Up or Move Down buttons to change the order in which the parameters are shown.
6. When the Parameters and Statistics are arranged, click OK.
When the Parameters and Statistics buttons are pluses, the customize column settings are applied to the results table, and only those selections appear. If the buttons are minuses, that means that all parameters or statistics are shown.
To adjust a column's width
1. Click the right side border of the column you want to adjust
2. Drag the border to the right to expand or to the left to shrink the column width.