After you have familiarized yourself with the oscillators and begin to gain confidence in recurring patterns, the SMR Turning Point Indicators can be utilized for anticipating potential setups or exits from current trades. We use three turning point indicators−the SMR Solid Line Turning Point, the SMR Dotted Line Turning Point, and the SMR Moving Average Turning Point.
In this section, we have focused on the SMRSLTP for all of our examples. However, all three indicators use the same general principles, their differences are in their time frames (e.g. short, intermediate, and long term).
Clicking the SMRSLTP button in CQG, will bring up two tick marks−the first tick represents today’s SMRSLTP, and the second tick represents tomorrow’s SMRSLTP. The SMRSLTP is the value at which the market would have to close in order for the SL to change direction, either up or down. Although you can’t determine from our examples which is up and which is down, if you were viewing your screen an SMRSLTP Down indicator would be a red tick mark and an SMRSLTP Up indicator would be a blue tick mark. Knowing these values will not only help in your anticipation of entering excellent momentum trades, but can also help in determining when a trade may be coming to an end or where a stop should be placed in order to guard against a change in momentum.
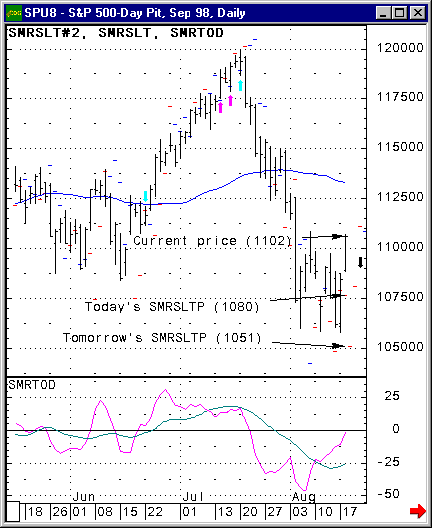
The example below is a chart of the Sept S&P 500 futures. If you are looking to go short the S&P and want to enter the market when the short-term momentum has changed and begins to turn back down, watching the SMRSLTP is crucial. As you can see the SL is headed up from an oversold condition. The SMRSLTP is showing that the market would have to close today at about 1080 in order for the SL to turn down. And if the market closes at its current price of 1102 then it would have to get down to about 1051 tomorrow for the SL to turn down. In other words, the closing price is getting further away from the SL turning point. Based on these observations, we would not recommend selling the S&P 500 just yet.
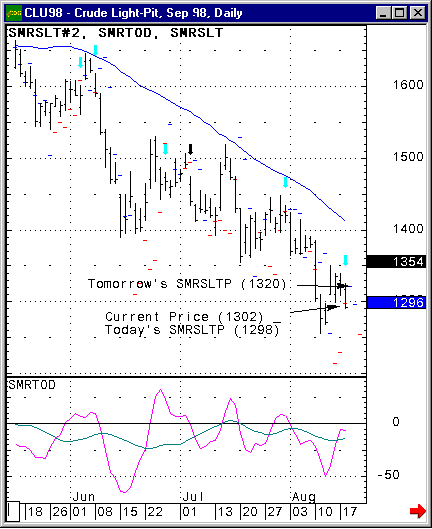
The example below is a chart of Sept Crude Oil. Like the S&P you would be looking for an entry into the market by following the 49-Day Moving Average and the DL, and using the SL as the shorter-term trigger. The SMRSLTP indicates that the SL will turn down if the market closes below 1298 today. And at its current price of 1302, the market would just have to stay below 1320 tomorrow, in order for the SL to turn down. In this instance, Crude Oil looks like a great sell!
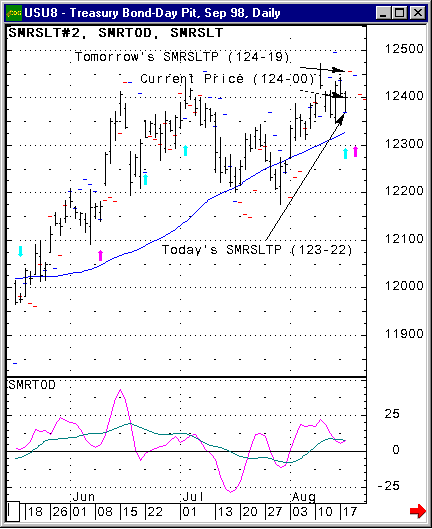
This example is a chart of the US Treasury Bonds. The market over the last week has been choppy and the SL is approaching "0" Zero Line, when this occurs the SL is very susceptible to market movement and can change direction on a dime. In this case the SMRSLTP is indicating that the SL will turn up if the Bonds close above 123-22 today, but will turn back down if they close below 124-19 tomorrow. Here is an example of when the SMRSLTP is not much help, don’t overly depend on this indicator in choppy situations. If you decide to buy a market like this make sure to get out quickly if it’s not moving in your direction within a reasonable length of time.
Turning Point Parameters
These parameters apply to Dotted Line Turning Point (SMRDLT), Moving Average Turning Point (SMRMAT), and Solid Line Turning Point (SMRSLT).
•Color
•Weight
•MarkIt
•Speed: Speed of the indicator. Select very fast, fast, standard, slow, or very slow.
•Current Only
•Display