Almost equally important as a stop loss order is the target price or take profit order. When entering into a trade you must ask yourself two questions: “How much can I reasonably take out of this market?” and “How far can I reasonably expect this market to move?” Even the best trading signals can be worthless if no money management is implemented.
The volatility of a market can be a crucial factor when calculating whether a trade is worth putting on. After evaluating where a safe stop should be placed, you must next determine if the market has enough room to move in the direction you are trading without hitting major support or resistance. If the risk / reward ratio is not in your favor, then you should not enter the trade. As a general rule of thumb, your reward should always be more than your risk; otherwise, you stand little chance of surviving as a trader. The SMR Take Profit (SMRTP) was developed to determine how far a trade could move with or against you in one day.
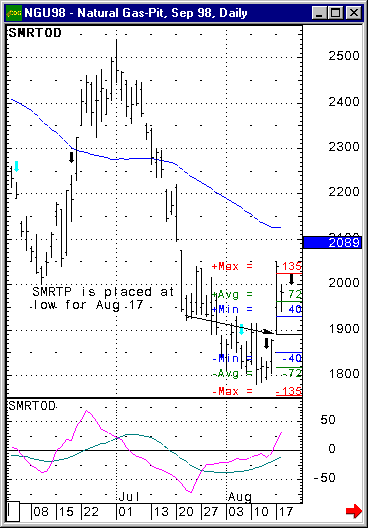
When you use the SMRTP you will need to choose what time period you will be evaluating. Usually, the last ten days are used; however, the best results are obtained by analyzing different time periods in order to find common results. Once the time period is chosen, placing the results on the chart will show you possible trading ranges for the current or next day. The results show the minimum, average, and maximum daily ranges for the selected time period; these values can be viewed in either market points or dollars. The placement of the SMRTP is crucial in determining if and when you may want to take profit. For example, if you were studying the markets at the end of the day, you would usually place the results at the close of that day. You could then see what the potential outcomes are for the following day (e.g. maximum day with you, minimum day against you, etc.) If you are using the SMRTP during the day, you may want to use the intra-day high or low to place the results, assuming that the high or low is potentially the high or low of the day.
The example here is Sept Natural Gas. If you had been trading the short-term momentum indicator and caught the correction to the upside, you probably would be a little nervous holding a very volatile, expensive market against the major trend. The SMRTP indicator shows that Aug 17th daily range exceeds the maximum daily range for the time period of Aug 3rd to Aug 16th (10 trading days). If you are having doubts about a trade, you should have no problem taking profit near the maximum daily range; anything more is just greed and will hurt you in the long run.
Again, you always want to go for more than what you risk, but in reality trades don’t always go quite as anticipated. Using the SMRTP will give you an unbiased view about the potential of a trade. If you are not feeling good about a trade and/or the momentum of the market has slowed, remember you will never go broke by taking profit.
Take Profit Parameters
•Value: The value used for the projection line. Choose either the Open, High, Low, or Close.
•Date: The date used for the projection line.
•Time: The time used for the projection line.
•Period: Choose the number of days to be evaluated.
•Type: Choose Up, Down or Full.
•Unit: Choose Tick, Price or Dollar.
•Display
•Id: Choose whether the line labels should be justified left or right.
•IdWt: Thickness of Id label.
•ScaleLabel: If selected, the vertical scale values for the lines will be highlighted.