If there is ample market data, we can calculate a graph of Implied Volatility (IV) depending on the strikes. It is 2D Volatility Curve, which helps to find a value of IV even for those strikes that have no market data.
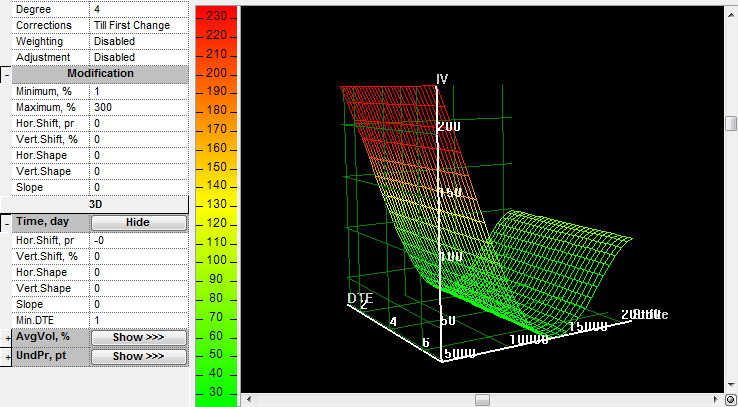
The calculated diagram represents the market state when it was generated. In reality, the change of market data should change the volatility curve. A 3D diagram allows you to select a third parameter to define the change of the 2D graph: time (days to expiration), average volatility, or underlying price.
These parameters clearly represent the changed market state and strongly affect IV values.
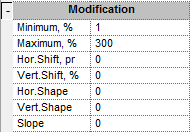
Volatility Workshop provides several modification parameters for time, average volume, and underlying price:
•Horizontal Shift (it is defined as option price value)
•Vertical Shift (in percent)
•Horizontal Shape
•Vertical Shape
•Slope
•Min.DTE (time only)
•Max Down % (AvgVol and UndPr only)
•Max Up % (AvgVol and UndPr only)
Let's consider time as an example.
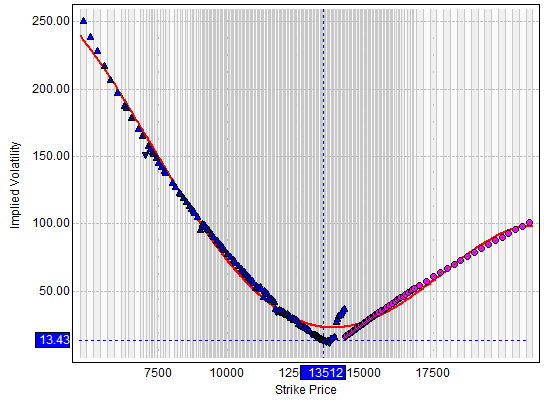
The volatility curve for current market state (the slice of the surface for DTE = 68) corresponds to the 2D diagram. However, this surface does not depend on DTE; it is the same for all DTE values. It is displayed according to the parameters of the Time type, and all modification parameters have value 0. (Min DTE value, which is 1, defines the left DTE limit value; it does not define any modification.) By changing one of the time parameters, such as changing the Vert. Shift % to 0.2, the volatility curve now depends on DTE value: the smaller DTE value, the higher IV value.
You can define the volatility surface as the method of Volatility Calculation to help you find the correct volatility value for the next day in situations where there is not ample data by using settlements for the previous date.
You can choose to define the IV depending on the Underlying Price or Average Volatility. These options operate under the same principles as Time. They offer additional parameters to define the range: Max. Down (in percent) and Max. Up (in percent), both of which is related to the current value of the price or volatility.