Evaluation results are displayed on four tabbed windows: Detail, Profit Curve, Distribution, and Summary.
Details
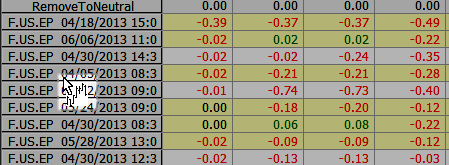
Lists the results for each of the bars comprising the period selected. Rows are set in Results View: Summary, while columns are set in Results View: Bars Out.
When you hover the mouse over a row, the cursor changes. In this mode, click the row to open a chart.
Profit Curve
Charts the strategy results by dollar or percent over the selected time period.
Distribution
Displays a histogram of the results.
Summary
Plots the value selected in Results View: Summary on the vertical axis and bars out on the horizontal axis.