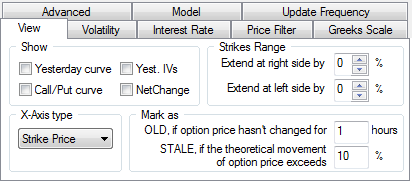
Show
Choose the elements to add to the Volatility Workshop display: Yesterday curve, Yest. IVs, Call/Put curve, or Net Change.
Each of these becomes an additional row in the table about the graph and are displayed on the graph.
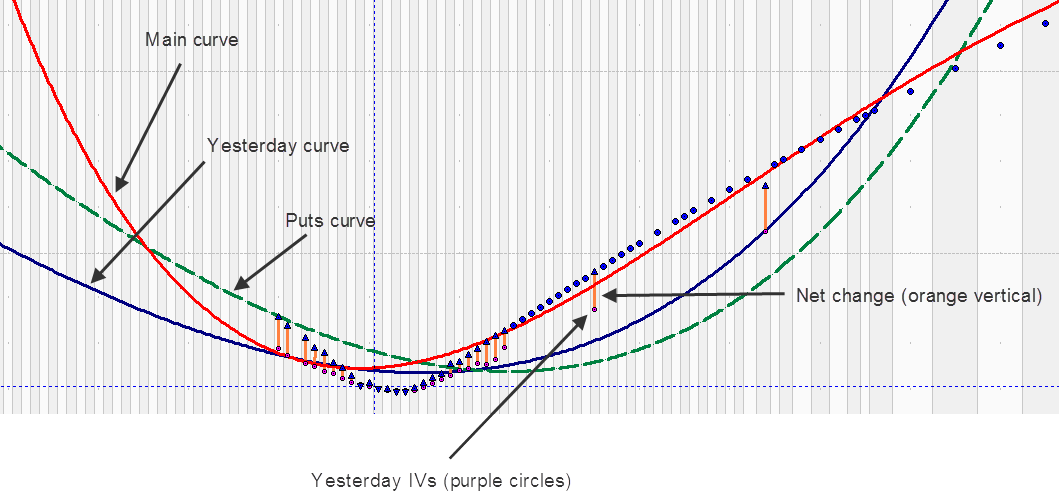
The curves are added to the graph. Yesterday’s IV (each option’s settlement IV) is represented as circles on the graph. Net change is represented as a vertical line between the current IV and yesterday's settlement IV.
Strikes Range
Expand the curves on the left and right side by a designated percentage. This facilitates estimating the IVs of options that have not yet been listed. For example, if the range prior to the expansion was from 1000 to 3000 and the range was expanded on the right side by 10 percent, the new range would be from 1000 to 3200 [(.1*(3000 - 1000) + 3000].
X-Axis type
Select the variable represented by the X-axis: Strike Price or Delta.
Mark as
Set the threshold for old prices, in hours, and stale movement, in percent.