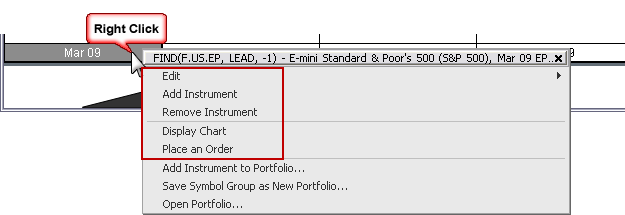
The instruments listed along the y-axis can be removed, and other instruments can be added. Both the forward and yield curves have the same menu options:

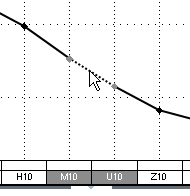
Highlight the instruments you want to work with. Click a single instrument to highlight it. To select multiple contracts, hold down CTRL while you click the instruments. You can click a segment of the curve to highlight the associated contracts, like this:

The Edit menu includes standard cut, copy, and paste functionality.
To change instrument on a curve chart
1. Right-click a highlighted contract.
2. Click Edit.
3. Click Change Instrument.
4. Type the instrument symbol in the Symbol box.
5. ENTER.
To add instruments to forward or yield curve
You may want to add instruments to the display, for example, adding EDAH10 to the Eurodollar forward curve. When you add an instrument, it will be placed to the right of the contract you click.
1. Right-click a contract.
2. Click Add Instrument.
3. Type the instrument symbol in the Symbol box.
4. ENTER.
You can also replace a contract with a set of contracts on the forward curve.
1. Click a contract.
For example, DDU9.
2. Type symbol and interval (months back and months forward).
For example, EP[-1,2].
3. ENTER.
DDU9 is replaced with 4 contracts: EPH9, EPM9, EPU9, EPZ9.
Interval [-1,2] includes lead month (0) = EPM9, 1 month back (-1) = EPH9, 1 month forward (1) = EPU9, 2 month forward (2) = EPZ9)
If you select all contracts and enter a new set, then only the first contract is replaced.
To remove instruments from a curve chart
1. Right-click the contract to delete.
2. Click Remove Instrument.
You can also click the contract and then DELETE.
To open a chart or spread chart
This option allows you to open a new chart for an instrument on the curve.
1. Right-click the contract that you want to display on a chart.
2. Click Display Chart.
For a spread chart:
1. Click an instrument.
2. While holding CTRL, click another instrument.
3. Right-click one of the highlighted instruments.
4. Click Display Spread Chart.
To place an order on a curve chart
1. Right-click the contract(s) you want to trade.
2. Click Place an Order.
According to your system preferences, either the DOMTrader, Order Ticket, or Simple Order Ticket will open. If you have selected two contracts to trade, then CQG Spreader opens.