Right-click the title bar to:
•Rename the window.
•Select an account.
•Size the window to fit the columns and rows.
•Show or hide tabs.
Standard shortcuts apply: Ctrl+C, Ctrl+X, and Ctrl+V for copying, cutting, and pasting.
You can also use the Edit menu (right-click a symbol, then click Edit).
When using that menu, Paste replaces the current row, while Insert adds a new row.
Copying to Excel
Right-click a symbol, then click Copy to Excel. All symbol data is copied in RTD format. Right-click the Symbol column heading, then click Copy All to copy and paste the entire monitor.
Right-click a price cell, then click Copy to Excel. Only that cell is copied.
Right-click the Price column heading, then click Copy to Excel to copy and paste all symbols with prices.
To add single instruments
Click a blank cell, type the instrument, and then ENTER to move to the next line. You can also right-click and select Add Instrument.
If you have entered a multi-symbol formula, press CTRL+ALT+SHIFT+ENTER to list the outrights of that formula also.
To add multiple instruments (portfolio)
By using a portfolio of symbols, you can add all of the symbols in that portfolio to the Portfolio Monitor at one time.
•Right-click a Symbol cell or the column heading, then point to Portfolio, and click the name of the portfolio you want to add.
•If you do not have a portfolio created, click Create New Portfolio.
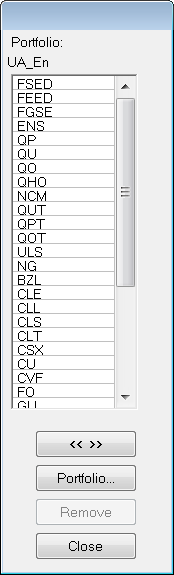
•If you want to add some, but not all, portfolio symbols or if you want to remove symbols from the portfolio before adding it, click Open Portfolio Window to open this abridged version of the Define Portfolio window:
•When the window is opened, the bottom symbol is highlighted. Click the arrow button to add that symbol to the monitor. Each time you click the button, the next symbol in the list is added.
•To skip symbols, use the
•mouse or keyboard to move up and down the list.
•Click the Portfolio button to open the Define Portfolio window.
•Click Remove to remove the symbol from the portfolio.
To insert rows, including blank rows
When you insert a row, it is added above the selected row.
1. Right-click the Symbol cell, then click Add Instrument/Blank Row.
2. Type a symbol, and ENTER or click outside of the Symbol cell to insert a blank row.
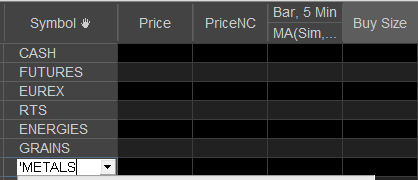
To add a comment row
Type an apostrophe followed by the comment you wish to add. Comment cells are commonly used to organize symbols. You can separate rows by asset class, exchange, or market. In this image, “metals” is being added as a comment:
Visual parameters for these comment rows can be changed.
To move a row
1. Click the cell in the blank column to the left of the symbol.
2. Click and drag the row to its new location.
3. Release the mouse button.
To remove instruments
Click the instrument and press DELETE. You can also right-click, point to Edit, then click Remove.
To change instruments
1. Right-click the instrument, point to Edit, then click Modify.
2. Type the new instrument.
3. ENTER.
To modify sessions for an instrument
1. Right-click the instrument, then click Modify Charts for <instrument>. The Sessions preferences window opens.
2. Make the desired changes.
3. Click OK.
To add price, study, and condition alerts
1. Right-click the instrument, point to Add Alerts, then click either Add Price Alert(s), Add Study Alert(s), or Add Condition Alert(s).
The alerts window opens and shows the symbol, studies, or conditions, respectively, that are included on that tab of the monitor.
2. Set parameters and actions, and turn off any alerts for studies you don’t want to use.
3. You can then close or minimize the window.
To open other applications
Right-click the instrument, then click Convert to Chart.
A chart for each chart interval for that symbol opens. So if you have 5-min, 60-min, and weekly chart columns for DL, then three charts open and they include all studies and conditions that have been applied.
You can also click Display Intraday Chart and Display Historical Chart. The chart interval is determined by which interval you used last.
Right-click the instrument, point to Display, then click either Time & Sales, SnapQuote, or Options.