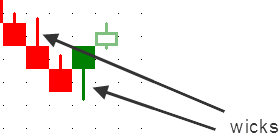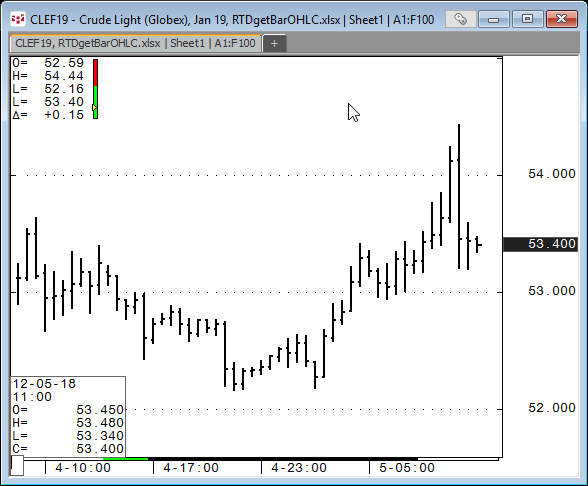
The XL Time Series Chart allows you to import data from Excel and display the data in a chart in CQG. If the data is updating real-time in Excel then the chart will also update as long as both Excel and CQG are open. As an example, the chart displayed below is pulling O, H, L, C 30-minute bar data from an Excel spreadsheet using RTD formulas.
The XL Time Series Chart is included in CQGIC subscriptions enabled for CQG Trading, or Spreader, as well as CQG Spreader systems. The XL Real-Time Study is available to base CQGIC subscriptions at additional cost.
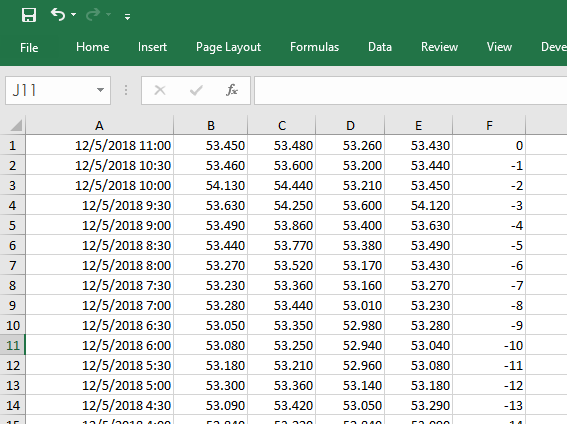
To start, setup your Excel file with the date and time in the first column, then open, high, low and close in the next four columns. Save the Excel file. You will need the name of the Excel file and the name of the tab (sheet name) with the data for your chart in CQG.
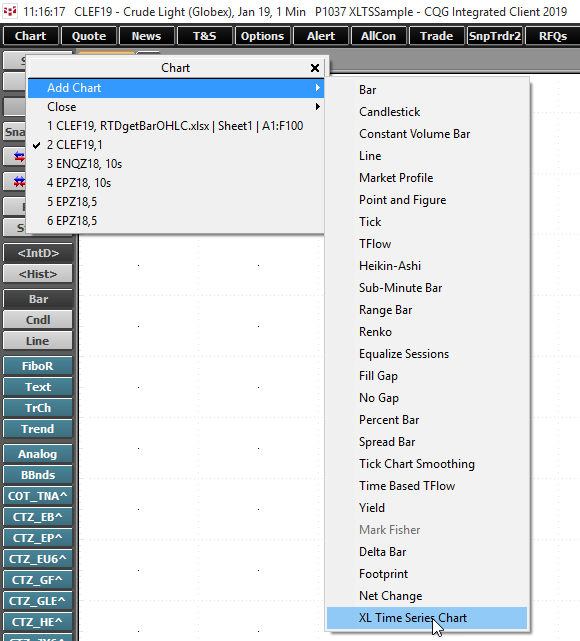
Next, right-click the Chart Tool button, select Add Chart and then XL TIME Series Chart.
A blank chart will open. Right-click in the empty chart and select Modify All Study Parameters.
Here, you enter in the exact name of the Excel file including the extension, such as xlsx of if it a macro spreadsheet then the extension would be xlsm. Enter the name of the Sheet (here Sheet1), the cell range references. Here, column A is the Date and time and column B, C, D and E are the data columns. Select Separate Date and Time if you use two columns for date and time. You can display a bar, line or a candle chart.