CQG sets the initial Market Profile scale to display complete distributions. If the distributions are relatively tight, the scale may be shown in one-tick increments. When large distributions are displayed, the scale is often displayed in multiple tick increments, allowing the distributions to fit within the Market Profile window.
To rescale the prices
Dragging the scale up and down rescales the prices to the maximum of a one-unit increment. The increment is set as the Value Scale parameter and does not need to be the same as the tick size.
You can also enter a number in the Command Entry box. For example, entering a 5 would change the price scale to reflect minimum increments of 5 units.
When the price scale is manually adjusted, the resulting scale is centered on the price previously at the center of the price scale. However, if the price cursor is displayed when the scale is manually adjusted, the resulting scale is centered around the price identified by the cursor.
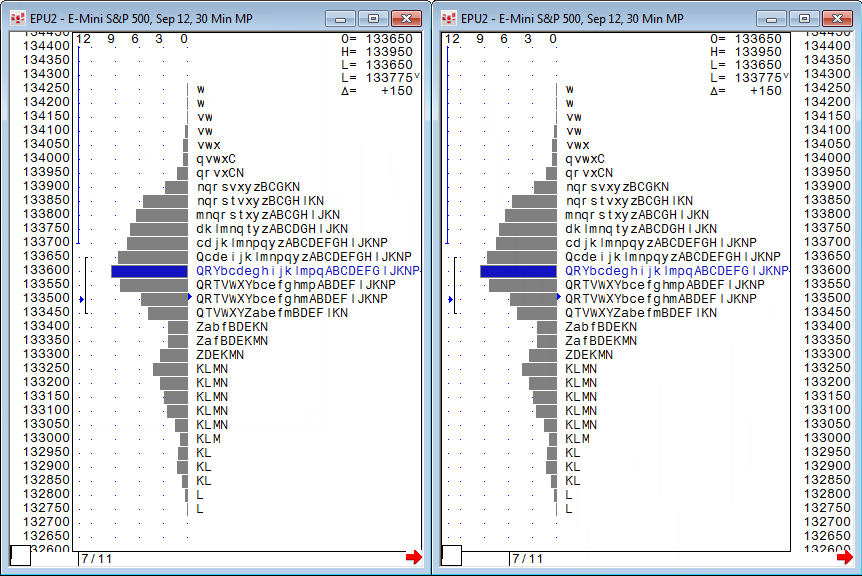
To move the scale to the right or left of the chart
Right-click the scale, and then click Move Scale to the Right or Move Scale to the Left.
This image shows the scale on the left and then on the right.
To use Auto Scale
The auto scale feature takes all the profiles visible on the current screen and scales them vertically so that each profile is completely visible and all the visible profiles completely fill the screen.
Right-click the scale, and then click Auto Scale.
To invert the scale
Like a bar chart, you can easily invert a Market Profile, so that the vertical scale values are 1/price.
Right-click the scale, and then click Invert.
You can choose to display both price and volume or one or the other.
1. Right-click the chart. The price and volume options are at the top of the menu.
2. Clear the checkmark from Prices to hide price. Only volume is shown.