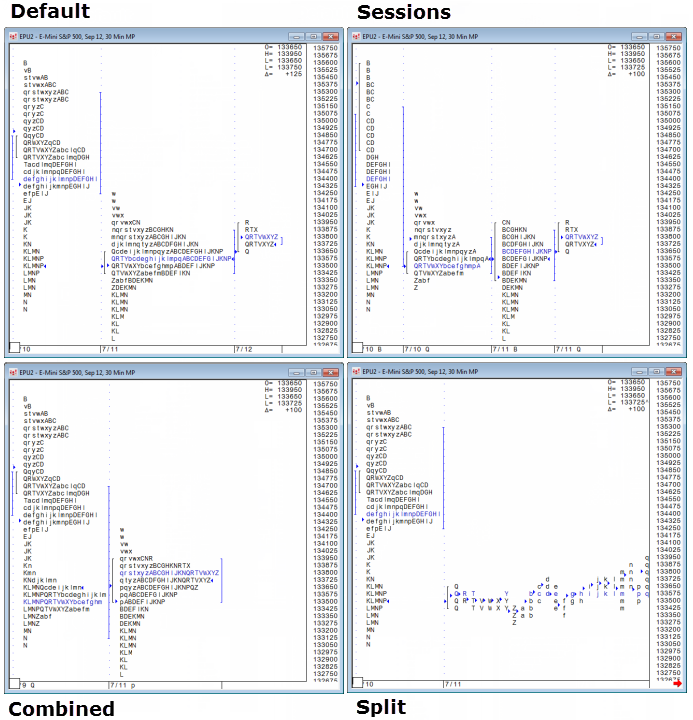
You can look at the TPO distribution in several ways. First, the profile is either default or session:
•Default profile: shows the distribution for each day (24 hours)
•Session profile: shows the distribution for each session
•Mini Profile: shows the individual distributions by TPO letter
Then, each of those profile types can be combined, split, or neither.
•Combined: shows the (daily or session) distribution for a custom period of time, such as 48 hours or one week
•Split: shows the distribution for each 30-min period or for a custom period of time, such as two hours
To change the position of the distributions in the window
You can change the position or location of the Market Profile distributions within the window without changing the profile. This is helpful when some part of the distribution does not appear in a smaller window.
1. Click the Market Profile and drag the mouse up, down, left, or right.
2. When you have the distributions repositioned, release your hold on the mouse.
To display distributions by session
1. Right-click the Market Profile. You can also right-click the time scale.
2. Click Session Profiles.
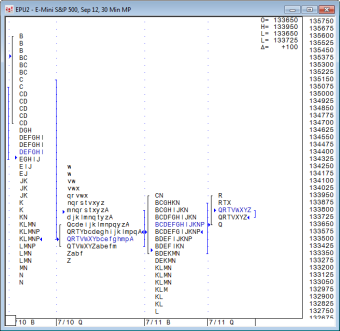
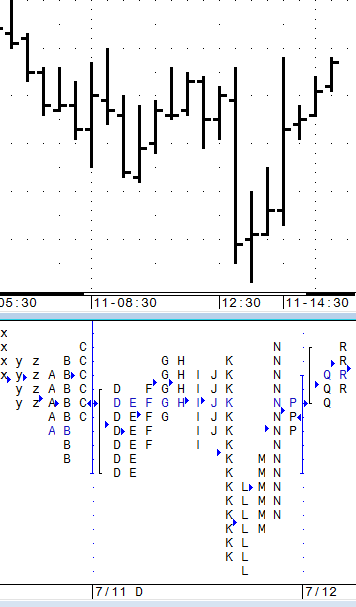
This image shows distribution by session. Notice the session indicators near the date at the bottom of the window. This symbol has a session at Q and at B.
To return to default sessions, right-click the Market Profile, and then click Session Profiles to remove the check mark.
To display Mini Profiles
1. You right-click the time scale and select Mini Profiles.
To return to default sessions, right-click the the time scale, and then click Session Profiles.
To combine distributions
1. Click and drag the current date to the left. Notice that the date and time indicator changes.
2. When you get to the date and time you want, release your hold on the mouse. The combined distribution is from that date and time to the current date and time.
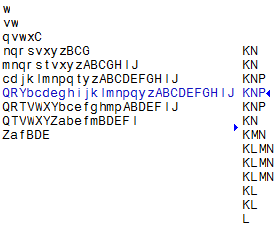
This image shows combined distribution. Notice that B repeats in the same line.
To return to the default profile in all time frames, right-click the Market Profile, and then click Default Profiles. You can also right-click the time scale.
To return to the default profile in this time frame only, right-click the time scale for this time frame, and click Restore Original Profile.
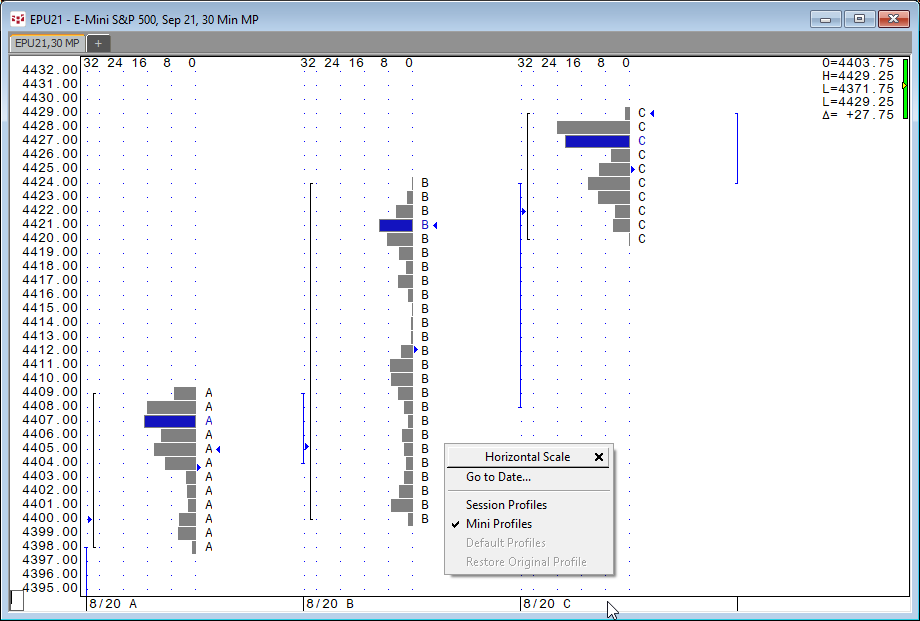
Splitting distributions allows you, potentially, to see each price a contract traded at during the specified time period.
You can split the distribution at each 30-min time period or at a specific time.
To split into 30-min sections, click the Split button. You can also right-click the Market Profile, and click Add Splits.
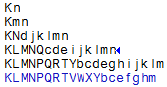
This image shows a 30-min split. Notice its similarity to a chart.
To split at a certain time, click the letter for that time. Let’s consider a simple example. Suppose I want to see everything that happened before and after 9:00 a.m. I click the C and the chart splits at C.
To remove the splits in this time frame only, right-click the Market Profile in the time frame of the split, and click Remove Splits.
To remove all splits in every time frame, right-click the Market Profile, and click Remove All Splits.