What it does
Derived from contributions medieval mathematician Leonardo Fibonacci made to numbers theory, retracements measure price areas where a market move is likely to pause or reverse a trend. Many traders rely on Fibonacci numbers to compute these levels of support and resistance.
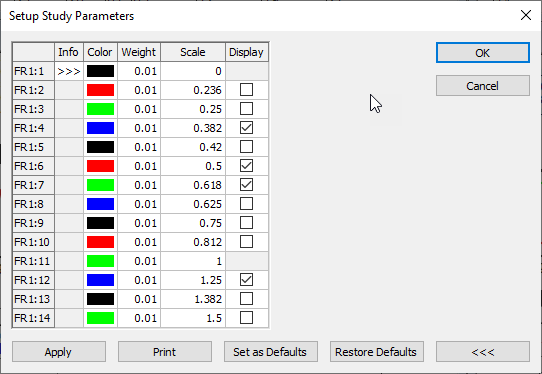
Default ratios for retracement scales:

How to use it
1. Right-click the chart, point to Pointer Tools, point to Fibonacci, then click Retracement.
2. Click to establish the starting point.
3. Drag the cursor up the chart to establish the second point, and click.
Fibonacci Retracements parameters
FR1:FR1
|
Parameter |
Description |
|
Value |
Enter a value or choose the open, high, low, or close. |
|
Date |
Defines the date of the reference bar. |
|
Time |
Defines the time of day for the reference bar. This applies to intraday use. |
|
Display |
Determines the direction and length of the line. Options include: Pnt1-Pnt2 -> (from point one and all the way right) <- Pnt1-Pnt2 (from point two and all the way left) Pnt1-Pnt2 (between points one and two) <- Pnt1-Pnt2 -> (all the way left and all the way right) Pnt2 -> (from point two and all the way right) <- Pnt1 (from point one and all the way left) |
|
Id |
Turns on and off the labels for the Fibonacci lines. |
|
IdWt |
Select normal or bold for thickness of ID. |
|
UseLog |
UseLog is applicable only when using charts set to logarithmic scales under scale type. When UseLog is selected, the Fibonacci retracements calculate percentage retracements based on the log scale, not the linear scale. For example, a 50% retracement of a move from 300 to 500 using a linear scale is 400. Using the log scale the 50% retracement of a move from 300 to 500 is 387.30. |
|
ScaleLabel |
Select this checkbox to color-code the price scale according to the trend line. |
FR1:FR2
|
Parameter |
Description |
|
Value |
Enter a value or choose the open, high, low, or close. |
|
Date |
Defines the date of the reference bar. |
|
Time |
Defines the time of day for the reference bar. This applies to intraday use. |
|
Display |
Opens display parameters: Color = Select color of line. Weight = Select thickness of line. Scale = Adjusts the default ratios for placement of lines. Display = Select the check box to show the circle on the chart. |