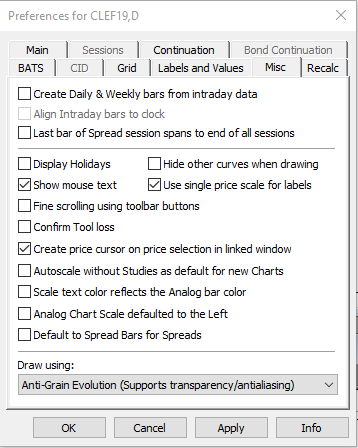
Miscellaneous settings apply to various chart behaviors.

To access these settings, click Setup, then Chart Preferences, and then click the Misc tab.
|
Preference |
Description |
|
Create Daily & Weekly bars from intraday data |
When selected, bars are constructed based on the last trade of the day. Otherwise, bars are constructed based on the settlement price. This allows trades that are done after the close of trading to be included in the bar. For instruments with no daily bar activity, CQG uses the close of the previous bar when calculating values that depend on previous values, such as moving averages. However, on a chart that displays raw prices, periods where there is no activity are left blank. |
|
Align Intraday bars to clock |
When selected, the bars align to the nearest half-hour point after the first bar. Therefore, when a 30-minute pork belly chart is set to align with the clock, the first bar plots at 9:10, then 9:30, 10:00 and every 30-minutes thereafter. You can accomplish the same goal by entering the minutes in the command line, preceded by an L. For example: PB,L30. Both methods produce a pork belly chart with bars at 9:10, 9:30, 10:00, 10:30, etc. You can unalign clock time by either clearing this check box or by entering the symbol, a comma, R, and the time frame in the command entry box. For example: PB,R60 produces a non-aligned 60-minute chart. Leave the alignment unchanged from the previous chart by entering the symbol, comma, time frame. For example, US,60 displays a chart that has the same alignment characteristic as the previously displayed chart, even if that chart had a different commodity symbol. |
|
Last bar of Spread session spans to end of all sessions |
For inter-commodity spreads, or any spread where the two contracts have different trading hours, you can select how to handle the pricing when one entity is not trading. Select this check box to have the spread calculated using the closing value for each subsequent bar of the later closing commodity plotted against the closing value of the contract with the earlier close. Unselect this check box to have the spread stop updating when the early contract closes, with all the values representing concurrent prices between the two commodities. |
|
Display holidays |
Daily charts only. When selected, CQG leaves a blank space on the chart to represent the holiday. On charts where Globex is trading on a holiday, the holiday Globex session is included in the bar for the day following the holiday. |
|
Show mouse text |
When selected, CQG shows tooltips. |
|
Fine scrolling using toolbar buttons |
If selected, allows you to scroll a chart horizontally by one bar at a time, using the Right/Left arrow button, or vertically by the minimum price change, using the Up/Down arrow button. |
|
Hide other curves when drawing |
Any non-pointer tool studies except the study that tool is applied to. |
|
Use single price scale for labels |
If selected, all chart labels are on one side of the chart. If right scale is available, then the labels are on the right, otherwise they are on the left. |
|
Confirm Tool loss |
When selected, CQG warns you that Trend Tools will be lost when a new chart is displayed. |
|
Create price cursor on price selection in linked window |
This option is turned on by default. When it is on, and a price is selected in a linked master or peer Trade Routing Interface (such as the DOMTrader), the corresponding horizontal price line is added to the Chart (or Market profile). If it is off, no such line will be added on the price selection. The options for Chart and Market Profile are independent. |
|
Autoscale without Studies as default for new Charts |
If selected, all new charts will autoscale without studies by default. |
|
Scale text color reflects the Analog bar color |
When selected, the vertical scale is colored the same color as the Chart Analog Overlay study. |
|
Analog Chart Scale defaulted to the left |
When selected, the vertical scale for the overlaid study will appear on the left side of the chart. |
|
Default to Spread Bars for Spreads |
When selected, the chart type automatically changes from bar to Spread Bar when you enter a synthetic spread. You’ll notice this message on the chart:
The chart type reverts to the previous bar chart when you enter a non-synthetic-spread symbol. Changing the chart type manually overrides this setting. |
|
Draw using |
Select GDI, GDI+, or D2D. Transparency and antialiasing result in better looking graphics. Hardware acceleration, which uses hardware to perform functions normally performed by your system’s CPU, allows a compatible graphics card to assume some of the processing. GDI (default) = legacy Windows component that does not support transparency and antialiasing and does not support hardware acceleration. GDI+ = introduced with Windows XP and supports transparency and antialiasing but not hardware acceleration. Direct2D = introduced with Windows Vista and supports transparency and antialiasing and supports hardware acceleration. |