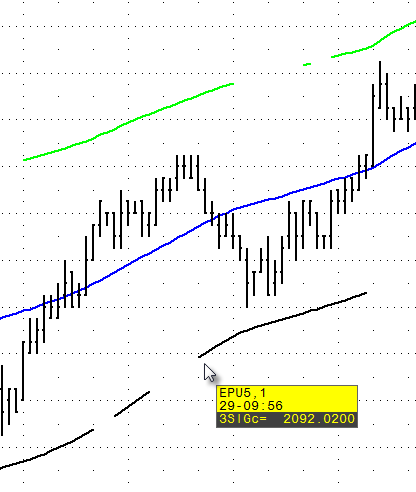
The ATM 3Sigma indicator dynamically calculates support and resistance in the direction of the selected time frame’s current trend. If in bull market it produce resistance lines. In a bear market it produces support lines.
It adjusts to current market conditions, appearing and disappearing as the market approaches.
The display is composed of seven lines:
•U3 = highest SRB line
•U2 = second highest SRB line
•U1 = third highest SRB line
•C = center
•D1 = third lowest SRB line
•D2 = second lowest SRB line
•D3 = lowest SRB line
Line color and thickness can be changed in parameters.
3Sigma parameters
|
Parameter |
Description |
|
Display |
Opens sub-window to set parameters: •Color = Line color. •Weight = Line thickness. |